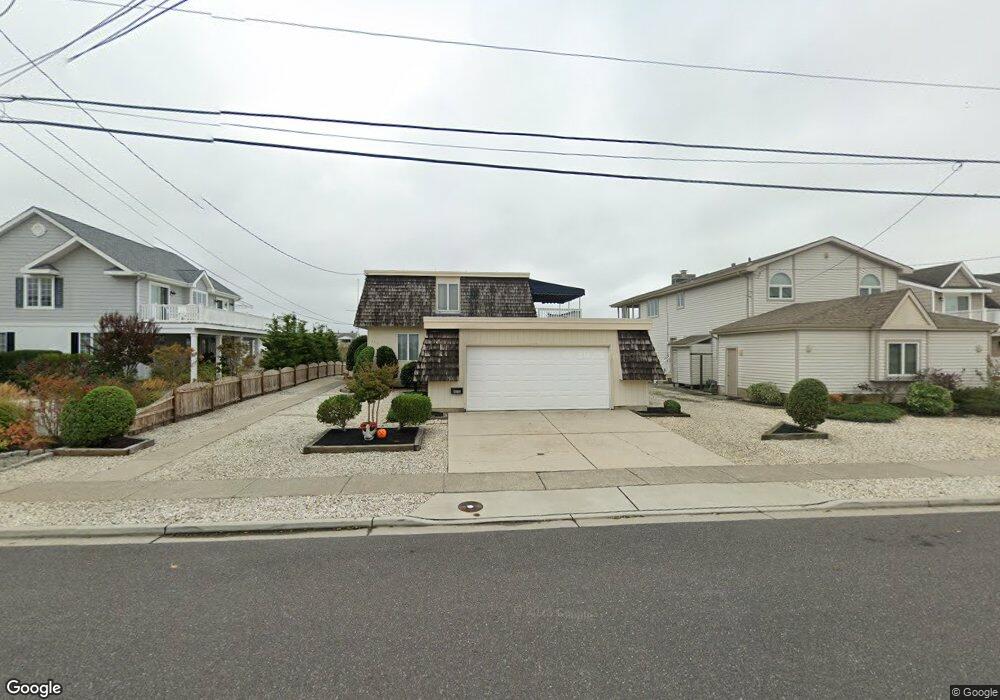
4315 5th Ave Avalon, NJ 08202
Estimated Value: $3,469,000 - $5,418,000
Studio
--
Bath
2,304
Sq Ft
$1,839/Sq Ft
Est. Value
About This Home
This home is located at 4315 5th Ave, Avalon, NJ 08202 and is currently estimated at $4,236,040, approximately $1,838 per square foot. 4315 5th Ave is a home located in Cape May County with nearby schools including Avalon Elementary School.
Ownership History
Date
Name
Owned For
Owner Type
Purchase Details
Closed on
Aug 19, 2021
Sold by
Branda Leslie L
Bought by
Leslie L Branda Ret
Current Estimated Value
Purchase Details
Closed on
May 21, 1990
Sold by
St Of Nj Tidelands Resource Council
Bought by
Branda Christopher and Branda Leslie L
Purchase Details
Closed on
Jun 9, 1979
Bought by
Branda Christopher and Branda Leslie L
Create a Home Valuation Report for This Property
The Home Valuation Report is an in-depth analysis detailing your home's value as well as a comparison with similar homes in the area
Home Values in the Area
Average Home Value in this Area
Purchase History
| Date | Buyer | Sale Price | Title Company |
|---|---|---|---|
| Leslie L Branda Ret | $64,079 | None Available | |
| Branda Christopher | $7,700 | -- | |
| Branda Christopher | $180,500 | -- |
Source: Public Records
Tax History
| Year | Tax Paid | Tax Assessment Tax Assessment Total Assessment is a certain percentage of the fair market value that is determined by local assessors to be the total taxable value of land and additions on the property. | Land | Improvement |
|---|---|---|---|---|
| 2025 | $11,558 | $1,882,400 | $1,700,000 | $182,400 |
| 2024 | $11,558 | $1,882,400 | $1,700,000 | $182,400 |
| 2023 | $11,464 | $1,882,400 | $1,700,000 | $182,400 |
| 2022 | $10,692 | $1,882,400 | $1,700,000 | $182,400 |
| 2021 | $10,297 | $1,882,400 | $1,700,000 | $182,400 |
| 2020 | $9,901 | $1,882,400 | $1,700,000 | $182,400 |
| 2019 | $9,600 | $1,882,400 | $1,700,000 | $182,400 |
| 2018 | $9,186 | $1,882,400 | $1,700,000 | $182,400 |
| 2017 | $9,948 | $1,789,200 | $1,600,000 | $189,200 |
| 2016 | $9,841 | $1,789,200 | $1,600,000 | $189,200 |
| 2015 | $9,680 | $1,789,200 | $1,600,000 | $189,200 |
| 2014 | $9,572 | $1,789,200 | $1,600,000 | $189,200 |
Source: Public Records
Map
Nearby Homes
- 4610 4th Ave
- 4640 Ocean Dr
- 4028 Ocean Dr Unit 2nd floor
- 360 39th St Unit East
- 256 42nd St
- 264 41st St
- 4040 Dune Dr
- 198 40th St
- 253 35th St Unit WEST
- 3429 Dune Dr
- 5499 Dune Dr
- 173 33rd St Unit 3
- 5765 Ocean Dr
- 179 32nd St
- 2934 Ocean Dr Unit North
- 3027 Dune Dr Unit 3
- 2928 Ocean Dr Unit C-N
- 3149 First Ave
- 55 32nd St W Unit C2B
- 55 32nd St W
Your Personal Tour Guide
Ask me questions while you tour the home.