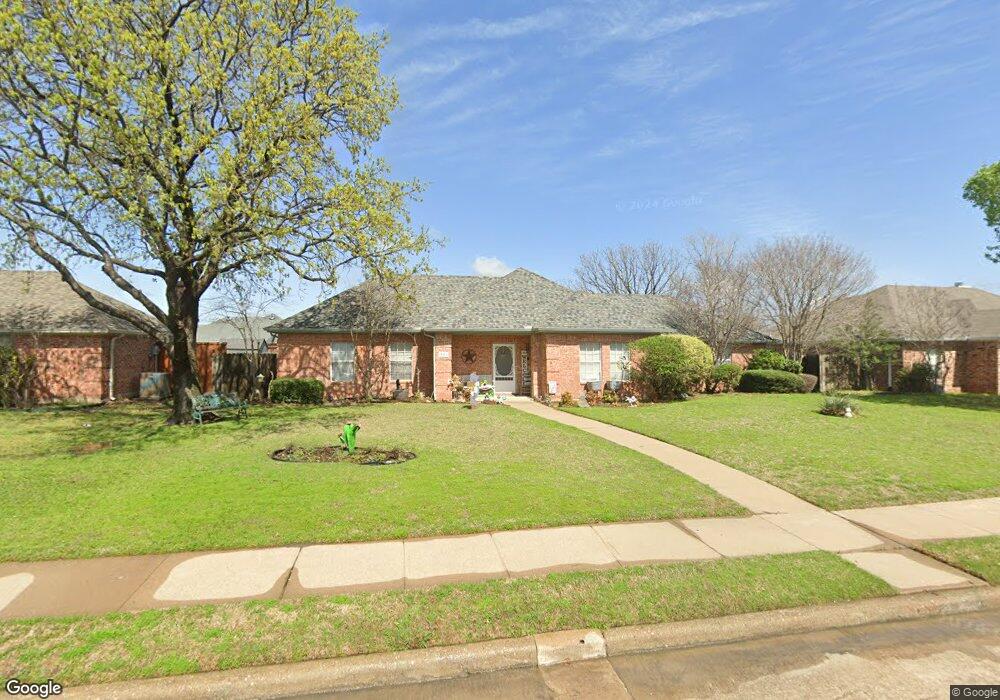
4315 Briarcrest Ln Sachse, TX 75048
Estimated Value: $326,355 - $332,000
3
Beds
2
Baths
1,452
Sq Ft
$226/Sq Ft
Est. Value
About This Home
This home is located at 4315 Briarcrest Ln, Sachse, TX 75048 and is currently estimated at $328,839, approximately $226 per square foot. 4315 Briarcrest Ln is a home located in Dallas County with nearby schools including Harmony Science Academy - Garland, Harmony School of Innovation - Garland, and Pinnacle Montessori of Sachse.
Ownership History
Date
Name
Owned For
Owner Type
Purchase Details
Closed on
Feb 22, 2001
Sold by
Lyons Gregory and Lyons Carita
Bought by
Duty James R
Current Estimated Value
Home Financials for this Owner
Home Financials are based on the most recent Mortgage that was taken out on this home.
Original Mortgage
$96,831
Outstanding Balance
$34,689
Interest Rate
6.97%
Mortgage Type
FHA
Estimated Equity
$294,150
Purchase Details
Closed on
Jun 29, 1998
Sold by
Kaiser Brian Edward and Kaiser Debbie A
Bought by
Lyons Gregory and Lyons Carita
Home Financials for this Owner
Home Financials are based on the most recent Mortgage that was taken out on this home.
Original Mortgage
$94,070
Interest Rate
7.08%
Mortgage Type
FHA
Purchase Details
Closed on
Aug 4, 1995
Sold by
Mobile Home Brokers Inc
Bought by
Kaiser Brian Edward and Kaiser Debbie A
Home Financials for this Owner
Home Financials are based on the most recent Mortgage that was taken out on this home.
Original Mortgage
$67,200
Interest Rate
7.51%
Create a Home Valuation Report for This Property
The Home Valuation Report is an in-depth analysis detailing your home's value as well as a comparison with similar homes in the area
Home Values in the Area
Average Home Value in this Area
Purchase History
| Date | Buyer | Sale Price | Title Company |
|---|---|---|---|
| Duty James R | -- | -- | |
| Lyons Gregory | -- | -- | |
| Kaiser Brian Edward | -- | -- |
Source: Public Records
Mortgage History
| Date | Status | Borrower | Loan Amount |
|---|---|---|---|
| Open | Duty James R | $96,831 | |
| Previous Owner | Lyons Gregory | $94,070 | |
| Previous Owner | Kaiser Brian Edward | $67,200 |
Source: Public Records
Tax History Compared to Growth
Tax History
| Year | Tax Paid | Tax Assessment Tax Assessment Total Assessment is a certain percentage of the fair market value that is determined by local assessors to be the total taxable value of land and additions on the property. | Land | Improvement |
|---|---|---|---|---|
| 2025 | $4,957 | $336,450 | $75,000 | $261,450 |
| 2024 | $4,957 | $336,450 | $75,000 | $261,450 |
| 2023 | $4,957 | $333,800 | $60,000 | $273,800 |
| 2022 | $6,370 | $266,260 | $60,000 | $206,260 |
| 2021 | $5,459 | $212,120 | $50,000 | $162,120 |
| 2020 | $5,549 | $212,120 | $50,000 | $162,120 |
| 2019 | $5,662 | $199,620 | $36,000 | $163,620 |
| 2018 | $5,717 | $199,620 | $36,000 | $163,620 |
| 2017 | $5,103 | $177,680 | $36,000 | $141,680 |
| 2016 | $4,574 | $159,280 | $30,000 | $129,280 |
| 2015 | $2,966 | $123,420 | $20,000 | $103,420 |
| 2014 | $2,966 | $123,420 | $20,000 | $103,420 |
Source: Public Records
Map
Nearby Homes
- 4415 Haverhill Ln
- 4609 Hunters Ridge Dr
- 4516 Harvest Ln
- 3821 Red Oak St
- 4612 Harvest Ln
- 4008 Leigh Ct
- 4819 Jackson Meadows Dr
- 3553 Leigh Ct
- 4133 Lone Elm St
- 3611 Valley Forge
- 3703 Stampede Dr
- 5207 Seth Ave
- 3361 Leigh Ct
- 3476 Rosewood Ln
- 5115 Willow Bend Ln
- 3610 Pacific Way
- 3602 Pacific Way
- 3731 Frost St
- 3302 Sewell Dr
- 3403 Scotsman Rd
- 4409 Briarcrest Ln
- 4309 Briarcrest Ln
- 4310 Hunters Ridge Dr
- 4306 Hunters Ridge Dr
- 4404 Hunters Ridge Dr
- 4314 Briarcrest Ln
- 4411 Briarcrest Ln
- 4305 Briarcrest Ln
- 4308 Briarcrest Ln
- 4406 Briarcrest Ln
- 4302 Hunters Ridge Dr
- 4408 Hunters Ridge Dr
- 4304 Briarcrest Ln
- 4410 Briarcrest Ln
- 4417 Briarcrest Ln
- 4311 Hunters Ridge Dr
- 4309 Haverhill Ln
- 4405 Hunters Ridge Dr
- 4307 Hunters Ridge Dr
- 4305 Haverhill Ln