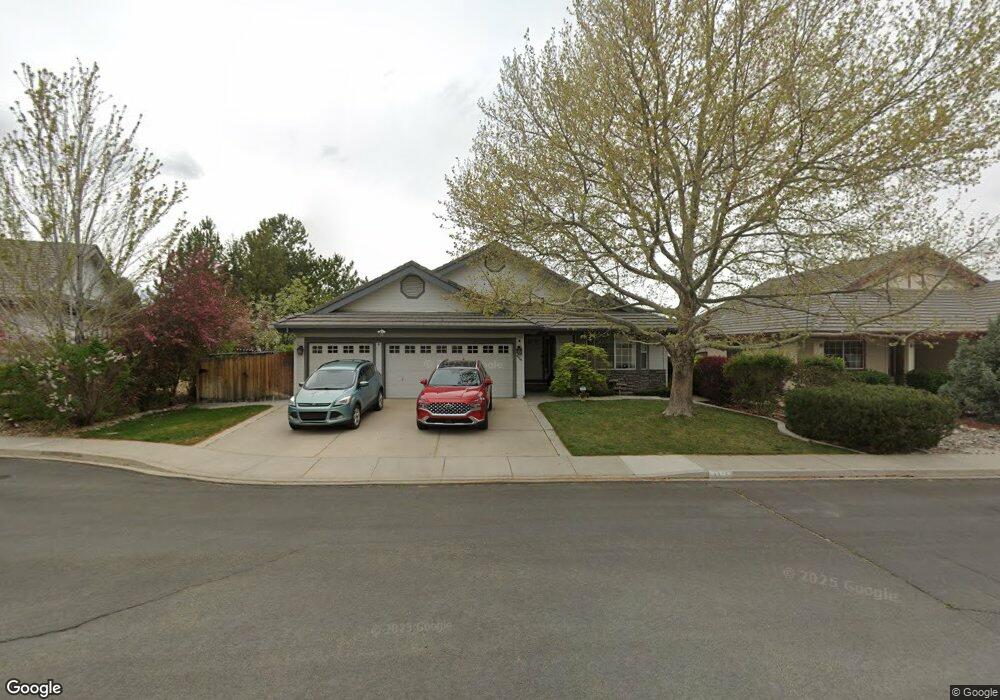
4315 Desert Hills Dr Sparks, NV 89436
Los Altos Parkway NeighborhoodEstimated Value: $682,730 - $739,000
3
Beds
2
Baths
2,515
Sq Ft
$282/Sq Ft
Est. Value
About This Home
This home is located at 4315 Desert Hills Dr, Sparks, NV 89436 and is currently estimated at $708,683, approximately $281 per square foot. 4315 Desert Hills Dr is a home located in Washoe County with nearby schools including Bud Beasley Elementary School and Edward C Reed High School.
Ownership History
Date
Name
Owned For
Owner Type
Purchase Details
Closed on
May 30, 2018
Sold by
Rodoni Karen Anne and Rodini Karen Anne
Bought by
Rodoni Karen A
Current Estimated Value
Purchase Details
Closed on
Mar 31, 2005
Sold by
Simonini Jude Anne
Bought by
Simonini Judith Anne and The Judith Anne Simonini Trust
Home Financials for this Owner
Home Financials are based on the most recent Mortgage that was taken out on this home.
Original Mortgage
$116,000
Outstanding Balance
$59,276
Interest Rate
5.73%
Mortgage Type
Unknown
Estimated Equity
$649,407
Purchase Details
Closed on
Feb 24, 2005
Sold by
Fralick Kathleen
Bought by
Simonini Jude Anne
Home Financials for this Owner
Home Financials are based on the most recent Mortgage that was taken out on this home.
Original Mortgage
$116,000
Outstanding Balance
$59,276
Interest Rate
5.73%
Mortgage Type
Unknown
Estimated Equity
$649,407
Purchase Details
Closed on
Sep 23, 1997
Sold by
Barker Homes Inc
Bought by
Fralick Kathleen
Home Financials for this Owner
Home Financials are based on the most recent Mortgage that was taken out on this home.
Original Mortgage
$256,550
Interest Rate
7.45%
Create a Home Valuation Report for This Property
The Home Valuation Report is an in-depth analysis detailing your home's value as well as a comparison with similar homes in the area
Home Values in the Area
Average Home Value in this Area
Purchase History
| Date | Buyer | Sale Price | Title Company |
|---|---|---|---|
| Rodoni Karen A | -- | None Available | |
| Simonini Judith Anne | -- | -- | |
| Simonini Jude Anne | $585,000 | Ticor Title Of Nevada Inc | |
| Fralick Kathleen | $342,500 | Stewart Title |
Source: Public Records
Mortgage History
| Date | Status | Borrower | Loan Amount |
|---|---|---|---|
| Open | Simonini Jude Anne | $116,000 | |
| Previous Owner | Fralick Kathleen | $256,550 |
Source: Public Records
Tax History Compared to Growth
Tax History
| Year | Tax Paid | Tax Assessment Tax Assessment Total Assessment is a certain percentage of the fair market value that is determined by local assessors to be the total taxable value of land and additions on the property. | Land | Improvement |
|---|---|---|---|---|
| 2025 | $5,012 | $168,346 | $72,352 | $95,994 |
| 2024 | $5,012 | $165,163 | $68,128 | $97,035 |
| 2023 | $4,643 | $157,713 | $65,807 | $91,906 |
| 2022 | $4,299 | $132,659 | $55,811 | $76,848 |
| 2021 | $3,981 | $117,178 | $40,520 | $76,658 |
| 2020 | $3,741 | $117,391 | $40,460 | $76,931 |
| 2019 | $3,564 | $115,112 | $41,412 | $73,700 |
| 2018 | $3,364 | $103,342 | $31,115 | $72,227 |
| 2017 | $3,267 | $101,120 | $28,788 | $72,332 |
| 2016 | $3,181 | $99,426 | $25,419 | $74,007 |
| 2015 | $1,590 | $96,391 | $22,540 | $73,851 |
| 2014 | $3,083 | $90,456 | $19,049 | $71,407 |
| 2013 | -- | $77,747 | $15,619 | $62,128 |
Source: Public Records
Map
Nearby Homes
- 4393 Acobat Ct
- 1850 Almonte Ct
- 1557 Satellite Dr
- 4675 Firtree Ln
- 1484 Serendipity Ct
- 1475 Golddust Dr
- 1425 Heaven Dr
- 1550 Istrice Rd
- 1685 Southview Dr
- 1560 Freeman Way
- 1357 Silver View Cir
- 3324 Danville Dr
- 4601 N Cactus Hills Ct
- 2415 Tecumseh Way
- 2427 Tecumseh Way Unit 8
- 3345 Groom Way
- 1575 Olinghouse St
- 4515 Whitney Cir
- 2316 Isabella Ct
- 4788 Ravello Dr
- 4325 Desert Hills Dr
- 4377 Desert Brush
- 4305 Desert Hills Dr
- 4335 Desert Hills Dr
- 4324 Desert Hills Dr
- 4314 Desert Hills Dr
- 4345 Desert Hills Dr
- 4304 Desert Hills Dr
- 4334 Desert Hills Dr
- 4350 Desert Hills Dr
- 4355 Desert Hills Dr
- 1715 Desert Mountain Dr
- 4365 Desert Hills Dr
- 1725 Desert Mountain Dr
- 1641 Cantinia Dr
- 1633 Cantinia Dr
- 4329 Cantamar Ct
- 4374 Desert Hills Dr
- 4319 Cantamar Ct
- 4349 Cantamar Ct