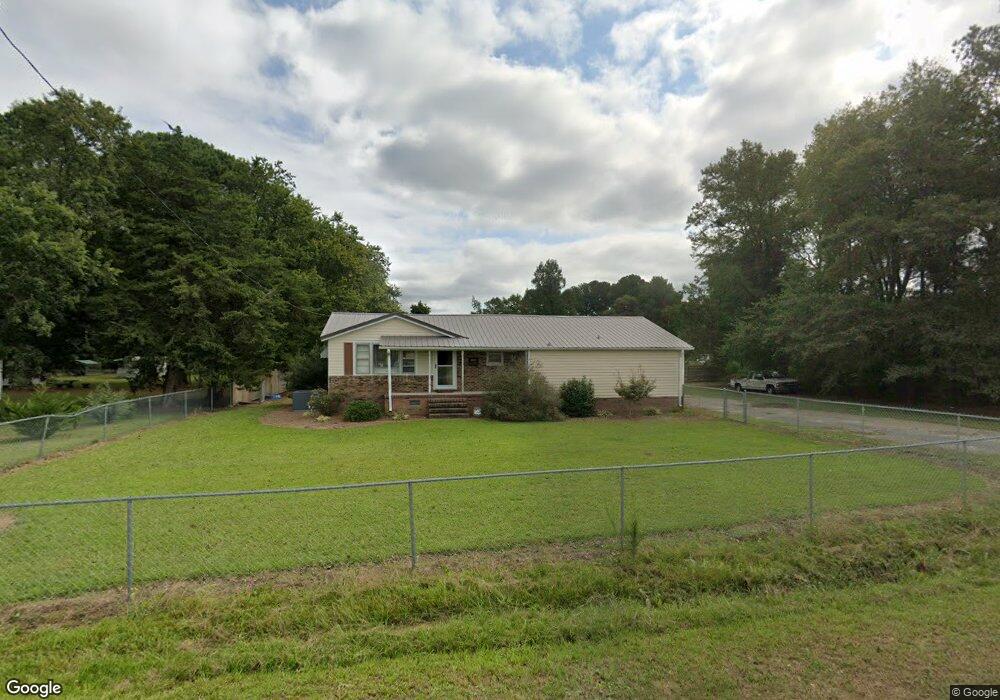
4315 Mark N Smith Rd Deep Run, NC 28525
Estimated Value: $124,000 - $158,000
2
Beds
1
Bath
836
Sq Ft
$175/Sq Ft
Est. Value
About This Home
This home is located at 4315 Mark N Smith Rd, Deep Run, NC 28525 and is currently estimated at $146,637, approximately $175 per square foot. 4315 Mark N Smith Rd is a home located in Lenoir County with nearby schools including Pink Hill Elementary School, Woodington Middle School, and South Lenoir High School.
Ownership History
Date
Name
Owned For
Owner Type
Purchase Details
Closed on
Jul 26, 2019
Sold by
Horne Donald R and Horne Shannon K
Bought by
Gardner Alex and Minsher Lindsay
Current Estimated Value
Home Financials for this Owner
Home Financials are based on the most recent Mortgage that was taken out on this home.
Original Mortgage
$75,000
Outstanding Balance
$65,584
Interest Rate
3.73%
Mortgage Type
New Conventional
Estimated Equity
$81,053
Purchase Details
Closed on
Nov 9, 2017
Sold by
Horne Shannon Kaye
Bought by
Horne Donald R
Purchase Details
Closed on
May 18, 2006
Sold by
Harper John Howard and Harper Jennifer
Bought by
Davis William R and Davis Velma D
Home Financials for this Owner
Home Financials are based on the most recent Mortgage that was taken out on this home.
Original Mortgage
$57,666
Interest Rate
6.39%
Mortgage Type
Future Advance Clause Open End Mortgage
Create a Home Valuation Report for This Property
The Home Valuation Report is an in-depth analysis detailing your home's value as well as a comparison with similar homes in the area
Home Values in the Area
Average Home Value in this Area
Purchase History
| Date | Buyer | Sale Price | Title Company |
|---|---|---|---|
| Gardner Alex | $75,000 | -- | |
| Horne Donald R | -- | None Available | |
| Davis William R | $58,000 | None Available |
Source: Public Records
Mortgage History
| Date | Status | Borrower | Loan Amount |
|---|---|---|---|
| Open | Gardner Alex | $75,000 | |
| Previous Owner | Davis William R | $57,666 |
Source: Public Records
Tax History
| Year | Tax Paid | Tax Assessment Tax Assessment Total Assessment is a certain percentage of the fair market value that is determined by local assessors to be the total taxable value of land and additions on the property. | Land | Improvement |
|---|---|---|---|---|
| 2025 | $1,030 | $128,775 | $27,559 | $101,216 |
| 2024 | $647 | $60,248 | $18,040 | $42,208 |
| 2023 | $635 | $60,248 | $18,040 | $42,208 |
| 2022 | $635 | $60,248 | $18,040 | $42,208 |
| 2021 | $635 | $60,248 | $18,040 | $42,208 |
| 2020 | $635 | $60,248 | $18,040 | $42,208 |
| 2019 | $545 | $60,248 | $18,040 | $42,208 |
| 2018 | $626 | $60,248 | $18,040 | $42,208 |
| 2017 | $623 | $60,248 | $18,040 | $42,208 |
| 2014 | $635 | $61,593 | $18,040 | $43,553 |
| 2013 | -- | $61,593 | $18,040 | $43,553 |
| 2011 | -- | $61,593 | $18,040 | $43,553 |
Source: Public Records
Map
Nearby Homes
- 1807 Will Cunningham Rd
- 4048 Bob Stroud Rd
- 2822 Ash Davis Rd
- 2618 Pinewood Home Dr
- 2 Harper Landing Dr
- 2771 H C Turner Rd
- 2888 H C Turner Rd
- 733 Tracy Rd
- 3030 Caroline
- 2201 Trent Cir
- 501 N Front St
- 5978 Hwy 258 S
- 1703 Walnut Run Dr
- 1775 Walnut Run Dr
- 1702 Cardinal Dr
- 1725 Cardinal Dr
- 1810 Hickerson Cir
- 1739 Cardinal Dr
- 00 E Pleasant Hill Rd
- 1127 N Carolina 11
- 4289 Mark N Smith Rd
- 1521 John Heath Rd
- 4339 Mark N Smith Rd
- 4373 Mark N Smith Rd
- 4246 Mark N Smith Rd
- 1403 Golden Pond Ln
- 1564 John Heath Rd
- 4401 Mark N Smith Rd
- 4445 Mark N Smith Rd
- 4457 Mark N Smith Rd
- 1641 John Heath Rd
- 4157 Mark N Smith Rd
- 1690 John Heath Rd
- 4163 Mark N Smith Rd
- 4115 Mark N Smith Rd
- 4521 Mark N Smith Rd
- 1734 John Heath Rd
- 4533 Mark N Smith Rd
- 1733 John Heath Rd
- 4087 Mark N Smith Rd
Your Personal Tour Guide
Ask me questions while you tour the home.