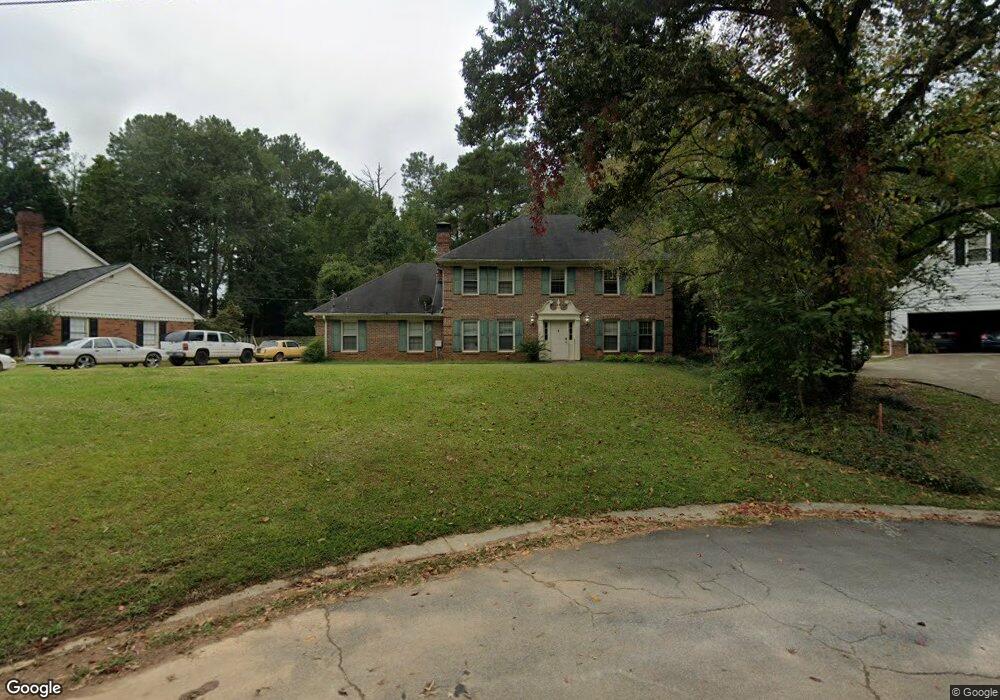
4315 Sophie Place SW Unit 1 Lilburn, GA 30047
Estimated Value: $351,000 - $402,000
4
Beds
3
Baths
2,278
Sq Ft
$168/Sq Ft
Est. Value
About This Home
This home is located at 4315 Sophie Place SW Unit 1, Lilburn, GA 30047 and is currently estimated at $382,774, approximately $168 per square foot. 4315 Sophie Place SW Unit 1 is a home located in Gwinnett County with nearby schools including Knight Elementary School, Trickum Middle School, and Parkview High School.
Ownership History
Date
Name
Owned For
Owner Type
Purchase Details
Closed on
Jun 11, 2015
Sold by
Colfin Ai Ga 1 Llc
Bought by
Cah 2015 1 Borrower Llc
Current Estimated Value
Purchase Details
Closed on
Oct 2, 2012
Sold by
Chowdhury Sree P
Bought by
Colfin Ai Ga 1 Llc
Purchase Details
Closed on
Feb 23, 2007
Sold by
Barford Marion A and Barford Terence H M
Bought by
Chowdhury Sree P
Home Financials for this Owner
Home Financials are based on the most recent Mortgage that was taken out on this home.
Original Mortgage
$171,120
Interest Rate
6.16%
Mortgage Type
New Conventional
Purchase Details
Closed on
Feb 21, 2007
Sold by
Branch Banking & Trust
Bought by
Barford Terence H M and Barford Marion A
Home Financials for this Owner
Home Financials are based on the most recent Mortgage that was taken out on this home.
Original Mortgage
$171,120
Interest Rate
6.16%
Mortgage Type
New Conventional
Create a Home Valuation Report for This Property
The Home Valuation Report is an in-depth analysis detailing your home's value as well as a comparison with similar homes in the area
Home Values in the Area
Average Home Value in this Area
Purchase History
| Date | Buyer | Sale Price | Title Company |
|---|---|---|---|
| Cah 2015 1 Borrower Llc | -- | -- | |
| Colfin Ai Ga 1 Llc | $112,002 | -- | |
| Chowdhury Sree P | $213,900 | -- | |
| Barford Terence H M | -- | -- |
Source: Public Records
Mortgage History
| Date | Status | Borrower | Loan Amount |
|---|---|---|---|
| Previous Owner | Chowdhury Sree P | $171,120 |
Source: Public Records
Tax History Compared to Growth
Tax History
| Year | Tax Paid | Tax Assessment Tax Assessment Total Assessment is a certain percentage of the fair market value that is determined by local assessors to be the total taxable value of land and additions on the property. | Land | Improvement |
|---|---|---|---|---|
| 2025 | $5,640 | $148,880 | $30,000 | $118,880 |
| 2024 | $5,483 | $142,880 | $30,000 | $112,880 |
| 2023 | $5,483 | $153,520 | $25,600 | $127,920 |
| 2022 | $3,716 | $93,920 | $17,600 | $76,320 |
| 2021 | $3,759 | $93,920 | $17,600 | $76,320 |
| 2020 | $3,065 | $99,800 | $17,600 | $82,200 |
| 2019 | $2,954 | $74,240 | $14,400 | $59,840 |
| 2018 | $2,954 | $74,240 | $14,400 | $59,840 |
| 2016 | $2,716 | $66,960 | $14,400 | $52,560 |
| 2015 | $2,519 | $60,640 | $8,000 | $52,640 |
| 2014 | -- | $53,520 | $4,800 | $48,720 |
Source: Public Records
Map
Nearby Homes
- Oxford Plan at The Preserve at Killian Hill - Townhomes
- 4358 Louis Rd SW
- 4239 River Branch Way
- 383 Ben Ave SW
- 246 Round Pond Dr
- 156 Round Pond Dr
- 146 King David Dr SW
- 445 Bruce Way SW
- 312 Westminister Ln SW
- 478 Dorsey Cir SW
- 4160 Tillrock Ln
- 4181 Tillrock Ln
- The Tyndall Plan at Annsbury Park
- The Maisie II Plan at Annsbury Park
- The Sadler Plan at Annsbury Park
- The Talbot Plan at Annsbury Park
- The Idlewild Plan at Annsbury Park
- 551 Killian Hill Rd SW
- 4151 Tillrock Ln
- 4171 Tillrock Ln
- 4325 Sophie Place SW
- 4305 Sophie Place SW Unit 1
- 4335 Sophie Place SW
- 252 Arcado Rd SW
- 248 Arcado Rd SW
- 4295 Sophie Place SW
- 4355 Sophie Place SW Unit 1
- 269 Hokes Place SW Unit 1
- 0 Arcado Rd SW Unit 7335990
- 0 Arcado Rd SW Unit 7344234
- 0 Arcado Rd SW Unit 8838900
- 0 Arcado Rd SW Unit 8810478
- 0 Arcado Rd SW Unit 8762071
- 0 Arcado Rd SW Unit 8394312
- 0 Arcado Rd SW Unit 3219026
- 0 Arcado Rd SW Unit 7551478
- 0 Arcado Rd SW Unit 7337389
- 0 Arcado Rd SW Unit 3187482
- 0 Arcado Rd SW Unit 3187122
- 0 Arcado Rd SW Unit 8000940