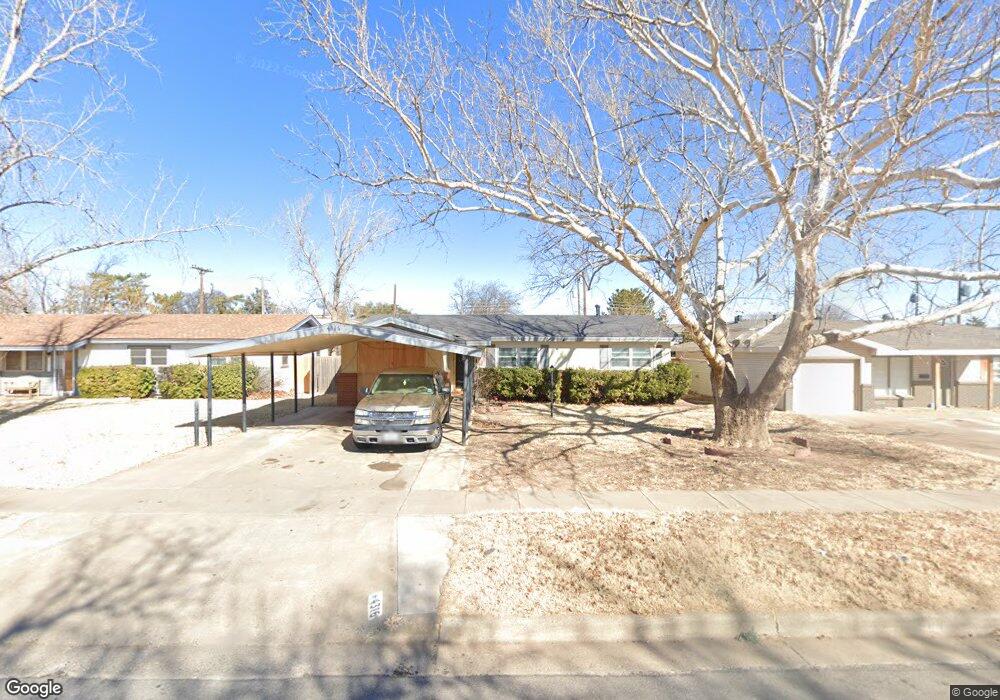
4316 29th St Lubbock, TX 79410
Maxey Park NeighborhoodEstimated Value: $177,186 - $208,000
3
Beds
2
Baths
1,548
Sq Ft
$123/Sq Ft
Est. Value
About This Home
This home is located at 4316 29th St, Lubbock, TX 79410 and is currently estimated at $190,797, approximately $123 per square foot. 4316 29th St is a home located in Lubbock County with nearby schools including Overton Elementary School, Commander William C. McCool Academy, and Mackenzie Middle School.
Ownership History
Date
Name
Owned For
Owner Type
Purchase Details
Closed on
Jun 7, 2019
Sold by
Campbell Three C Enterprises Llc
Bought by
Campbell Three C Ent 9 An Independent Se
Current Estimated Value
Purchase Details
Closed on
Jun 26, 2012
Sold by
Campbell Scott and Campbell Chester
Bought by
Campbell Three C Enterprises Llc
Purchase Details
Closed on
Jul 4, 2006
Sold by
Morrow Charles Glenn and Associates First Capital Corp
Bought by
Campbell Chester and Campbell Randy
Purchase Details
Closed on
May 29, 1995
Sold by
Flores Flores R and Flores Lucy
Bought by
Campbell Three C Enterprises Llc
Create a Home Valuation Report for This Property
The Home Valuation Report is an in-depth analysis detailing your home's value as well as a comparison with similar homes in the area
Home Values in the Area
Average Home Value in this Area
Purchase History
| Date | Buyer | Sale Price | Title Company |
|---|---|---|---|
| Campbell Three C Ent 9 An Independent Se | -- | None Available | |
| Campbell Three C Enterprises Llc | -- | None Available | |
| Campbell Chester | $41,000 | None Available | |
| Campbell Three C Enterprises Llc | -- | -- |
Source: Public Records
Tax History Compared to Growth
Tax History
| Year | Tax Paid | Tax Assessment Tax Assessment Total Assessment is a certain percentage of the fair market value that is determined by local assessors to be the total taxable value of land and additions on the property. | Land | Improvement |
|---|---|---|---|---|
| 2025 | $2,730 | $154,350 | $23,000 | $131,350 |
| 2024 | $2,730 | $150,329 | $23,000 | $127,329 |
| 2023 | $2,633 | $141,660 | $10,980 | $130,680 |
| 2022 | $2,434 | $120,215 | $10,980 | $109,235 |
| 2021 | $2,863 | $133,669 | $10,980 | $122,689 |
| 2020 | $1,995 | $91,733 | $10,980 | $80,753 |
| 2019 | $2,059 | $91,733 | $10,980 | $80,753 |
| 2018 | $1,746 | $77,654 | $10,980 | $66,674 |
| 2017 | $1,748 | $77,654 | $10,980 | $66,674 |
| 2016 | $1,475 | $65,535 | $10,980 | $54,555 |
| 2015 | $1,433 | $65,530 | $10,980 | $54,550 |
| 2014 | $1,433 | $64,450 | $5,400 | $59,050 |
Source: Public Records
Map
Nearby Homes