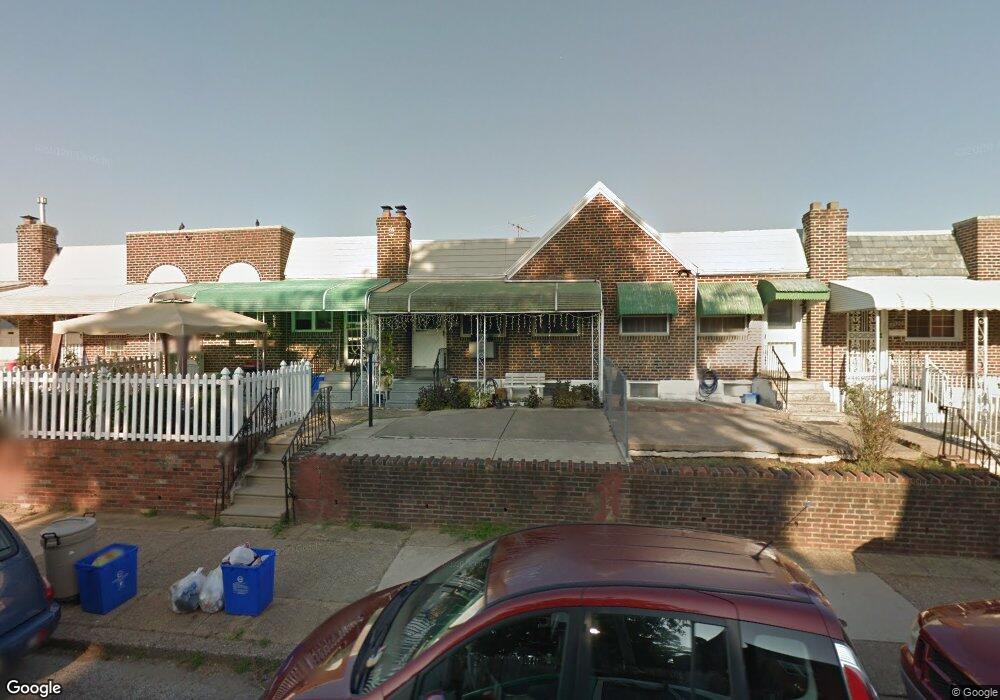
4316 Dungan St Philadelphia, PA 19124
Juniata Park NeighborhoodEstimated Value: $175,152 - $206,000
2
Beds
1
Bath
712
Sq Ft
$265/Sq Ft
Est. Value
About This Home
This home is located at 4316 Dungan St, Philadelphia, PA 19124 and is currently estimated at $188,788, approximately $265 per square foot. 4316 Dungan St is a home located in Philadelphia County with nearby schools including Frankford High School, Community Academy of Philadelphia CS, and Holy Innocents Area Catholic Elementary School.
Ownership History
Date
Name
Owned For
Owner Type
Purchase Details
Closed on
Jun 7, 2011
Sold by
Estate Of Elizabeth Kurek
Bought by
Rivera Joe
Current Estimated Value
Home Financials for this Owner
Home Financials are based on the most recent Mortgage that was taken out on this home.
Original Mortgage
$80,408
Outstanding Balance
$57,639
Interest Rate
5.5%
Mortgage Type
FHA
Estimated Equity
$131,149
Create a Home Valuation Report for This Property
The Home Valuation Report is an in-depth analysis detailing your home's value as well as a comparison with similar homes in the area
Home Values in the Area
Average Home Value in this Area
Purchase History
| Date | Buyer | Sale Price | Title Company |
|---|---|---|---|
| Rivera Joe | $82,500 | None Available |
Source: Public Records
Mortgage History
| Date | Status | Borrower | Loan Amount |
|---|---|---|---|
| Open | Rivera Joe | $80,408 |
Source: Public Records
Tax History Compared to Growth
Tax History
| Year | Tax Paid | Tax Assessment Tax Assessment Total Assessment is a certain percentage of the fair market value that is determined by local assessors to be the total taxable value of land and additions on the property. | Land | Improvement |
|---|---|---|---|---|
| 2025 | $1,954 | $155,100 | $31,020 | $124,080 |
| 2024 | $1,954 | $155,100 | $31,020 | $124,080 |
| 2023 | $1,954 | $139,600 | $27,920 | $111,680 |
| 2022 | $824 | $94,600 | $27,920 | $66,680 |
| 2021 | $1,454 | $0 | $0 | $0 |
| 2020 | $1,454 | $0 | $0 | $0 |
| 2019 | $1,351 | $0 | $0 | $0 |
| 2018 | $1,216 | $0 | $0 | $0 |
| 2017 | $1,216 | $0 | $0 | $0 |
| 2016 | $796 | $0 | $0 | $0 |
| 2015 | $762 | $0 | $0 | $0 |
| 2014 | -- | $86,900 | $19,424 | $67,476 |
| 2012 | -- | $11,296 | $1,588 | $9,708 |
Source: Public Records
Map
Nearby Homes