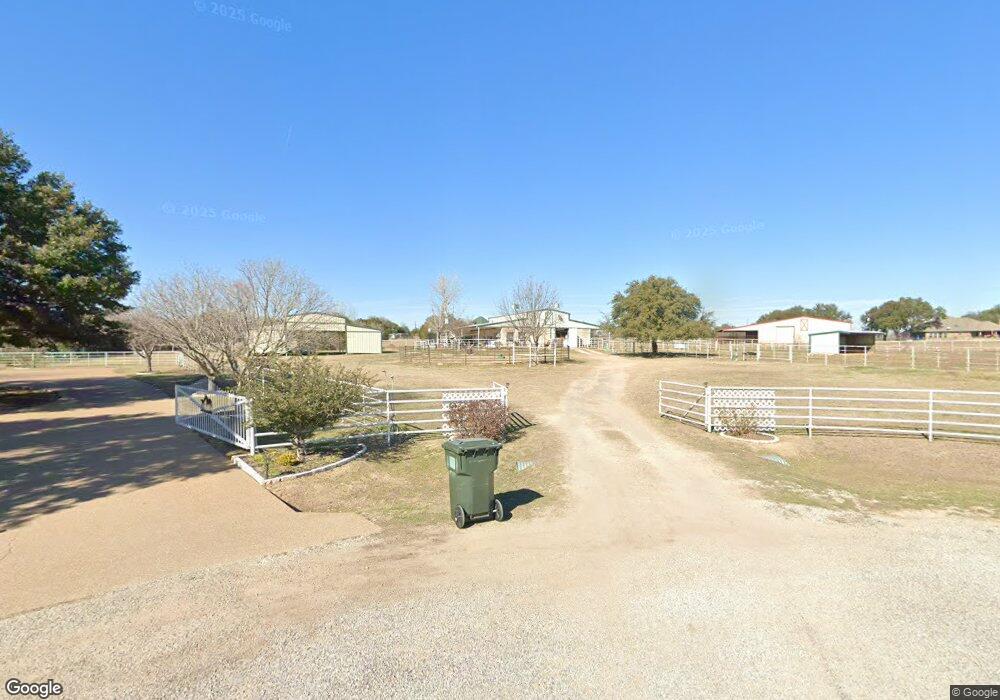
4316 Ivy Ct Granbury, TX 76049
Estimated Value: $715,053 - $927,000
--
Bed
--
Bath
3,868
Sq Ft
$210/Sq Ft
Est. Value
About This Home
This home is located at 4316 Ivy Ct, Granbury, TX 76049 and is currently estimated at $813,763, approximately $210 per square foot. 4316 Ivy Ct is a home located in Hood County with nearby schools including Acton Elementary School, Acton Middle School, and Granbury High School.
Ownership History
Date
Name
Owned For
Owner Type
Purchase Details
Closed on
May 9, 2016
Sold by
Horton Vicki Y and Tuley Becki Y
Bought by
Youngblood Barbara
Current Estimated Value
Purchase Details
Closed on
Dec 27, 2001
Sold by
Youngblood H L
Bought by
Youngblood Barbara
Purchase Details
Closed on
Jan 11, 2000
Sold by
Youngblood Youngblood H and Youngblood Nixie G
Bought by
Youngblood Barbara
Purchase Details
Closed on
Mar 14, 1996
Sold by
Harris Elestley
Bought by
Youngblood Barbara
Purchase Details
Closed on
Mar 13, 1996
Sold by
Vet Land Board
Bought by
Youngblood Barbara
Purchase Details
Closed on
Jul 18, 1994
Sold by
Vet Ld Bd(Barrett L O)N
Bought by
Youngblood Barbara
Purchase Details
Closed on
Jun 6, 1992
Sold by
Veterans Land Board
Bought by
Youngblood Barbara
Purchase Details
Closed on
Jun 4, 1992
Sold by
Vet Ld Bd(Satterfield J)N
Bought by
Youngblood Barbara
Purchase Details
Closed on
Apr 13, 1992
Sold by
Veterans Land Board
Bought by
Youngblood Barbara
Create a Home Valuation Report for This Property
The Home Valuation Report is an in-depth analysis detailing your home's value as well as a comparison with similar homes in the area
Home Values in the Area
Average Home Value in this Area
Purchase History
| Date | Buyer | Sale Price | Title Company |
|---|---|---|---|
| Youngblood Barbara | -- | Stonewall Title Company | |
| Youngblood Barbara | -- | -- | |
| Youngblood Barbara | -- | -- | |
| Youngblood Barbara | -- | -- | |
| Youngblood Barbara | -- | -- | |
| Youngblood Barbara | -- | -- | |
| Youngblood Barbara | -- | -- | |
| Youngblood Barbara | -- | -- | |
| Youngblood Barbara | -- | -- |
Source: Public Records
Tax History Compared to Growth
Tax History
| Year | Tax Paid | Tax Assessment Tax Assessment Total Assessment is a certain percentage of the fair market value that is determined by local assessors to be the total taxable value of land and additions on the property. | Land | Improvement |
|---|---|---|---|---|
| 2025 | $2,356 | $591,930 | $120,000 | $471,930 |
| 2024 | $2,367 | $610,610 | $70,000 | $599,650 |
| 2023 | $6,755 | $677,430 | $70,000 | $607,430 |
| 2022 | $4,591 | $663,010 | $40,000 | $623,010 |
| 2021 | $7,043 | $458,760 | $40,000 | $418,760 |
| 2020 | $6,506 | $423,210 | $27,600 | $395,610 |
| 2019 | $6,191 | $380,820 | $27,600 | $353,220 |
| 2018 | $5,831 | $358,680 | $22,800 | $335,880 |
| 2017 | $5,872 | $351,140 | $22,800 | $328,340 |
| 2016 | $5,610 | $335,500 | $22,800 | $312,700 |
| 2015 | $4,715 | $322,330 | $22,800 | $299,530 |
| 2014 | $4,715 | $322,330 | $22,800 | $299,530 |
Source: Public Records
Map
Nearby Homes
- 3707 Bob White Dr
- 2445 Bob White Dr
- 4410 Halo Ct
- 3119 Bob White Dr
- 3207 Hummingbird Ct
- 2925 Willow Ridge Cir
- 4363 Acton Hwy
- 3868 Legend Trail
- 4312 Rhea Rd
- 2936 Willow Ridge Cir
- 3917 Decordova Ranch Rd
- 3609 Upper Lake Cir
- 1141 Avery Rd
- 1144 Avery Rd
- 1136 Avery Rd
- 3606 Upper Lake Cir
- 3218 Fountain Way
- 3710 Decordova Ranch Rd
- 4920 Centre Ct
- 3711 Lonesome Creek Rd
- 3006 Crystal Lake Dr
- 3014 Crystal Lake Dr
- 4311 Ivy Ct
- 3000 Crystal Lake Dr
- 3100 Crystal Lake Dr
- 2901 Bob White Dr
- 2912 Crystal Lake Dr
- 4300 Ivy Ct
- 3005 Crystal Lake Dr
- 3104 Crystal Lake Dr
- 4301 Ivy Ct
- 3206 Crystal Lake Dr
- 3101 Crystal Lake Dr
- 3100 Bob White Dr
- 3013 Crystal Lake Dr
- 3300 Crystal Lake Dr
- 3009 Crystal Lake Dr
- 4404 Halo Ct
- 2916 Bob White Dr
- 2910 Bob White Dr