Estimated Value: $455,000 - $487,072
4
Beds
3
Baths
2,144
Sq Ft
$222/Sq Ft
Est. Value
About This Home
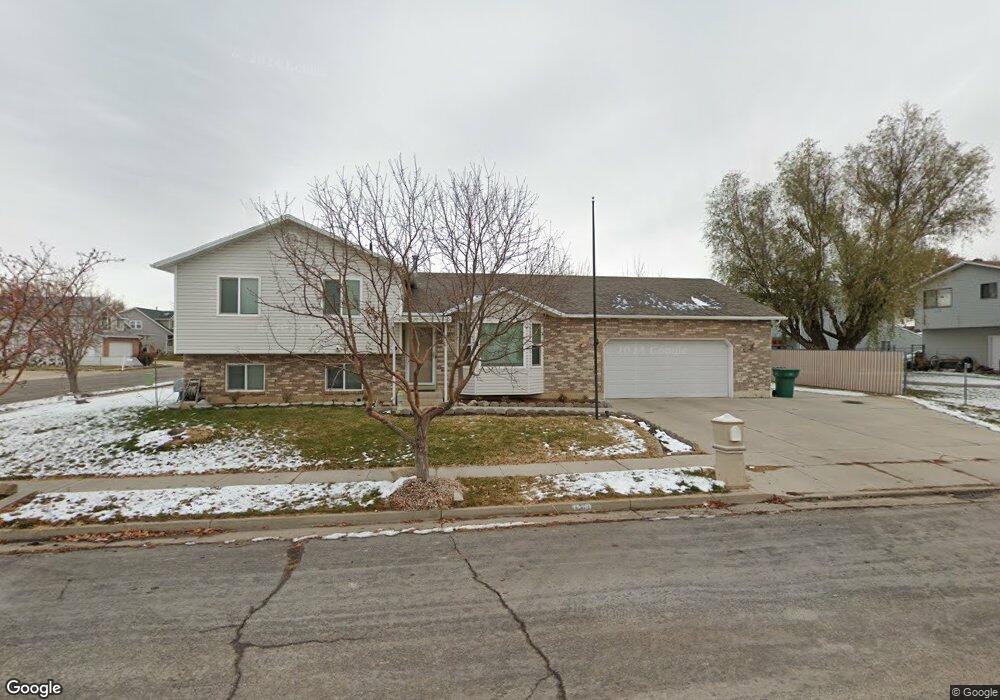
This home is located at 4316 S 2875 W, Roy, UT 84067 and is currently estimated at $476,268, approximately $222 per square foot. 4316 S 2875 W is a home located in Weber County with nearby schools including Midland School, Sand Ridge Junior High School, and Roy High School.
Ownership History
Date
Name
Owned For
Owner Type
Purchase Details
Closed on
Apr 2, 2021
Sold by
Abarca Chelsea and Abarca Kristian
Bought by
Vanvu Hoang and Vu Phuong T
Current Estimated Value
Home Financials for this Owner
Home Financials are based on the most recent Mortgage that was taken out on this home.
Original Mortgage
$350,416
Outstanding Balance
$315,873
Interest Rate
2.9%
Mortgage Type
New Conventional
Estimated Equity
$160,395
Purchase Details
Closed on
Feb 18, 2016
Sold by
Marsh Blake K and Marsh Jaclyn
Bought by
Abarca Chelsea
Home Financials for this Owner
Home Financials are based on the most recent Mortgage that was taken out on this home.
Original Mortgage
$217,180
Interest Rate
3.97%
Mortgage Type
VA
Purchase Details
Closed on
Oct 22, 2012
Sold by
Marsh Blake and Marsh Jaclyn
Bought by
Marsh Blake K
Home Financials for this Owner
Home Financials are based on the most recent Mortgage that was taken out on this home.
Original Mortgage
$195,911
Interest Rate
3.5%
Mortgage Type
FHA
Purchase Details
Closed on
Apr 9, 2009
Sold by
Marsh Jaclyn and Marsh Blake K
Bought by
Marsh Blake
Home Financials for this Owner
Home Financials are based on the most recent Mortgage that was taken out on this home.
Original Mortgage
$175,112
Interest Rate
5.06%
Mortgage Type
FHA
Purchase Details
Closed on
Mar 27, 2007
Sold by
Whinham Mark and Whinham Eileen
Bought by
Marsh Blake K
Home Financials for this Owner
Home Financials are based on the most recent Mortgage that was taken out on this home.
Original Mortgage
$171,000
Interest Rate
6.2%
Mortgage Type
Purchase Money Mortgage
Purchase Details
Closed on
Oct 30, 2002
Sold by
Whinham Mark G and Whinham Eileen
Bought by
Whinham Mark
Home Financials for this Owner
Home Financials are based on the most recent Mortgage that was taken out on this home.
Original Mortgage
$116,800
Interest Rate
5.99%
Mortgage Type
Purchase Money Mortgage
Purchase Details
Closed on
Jun 26, 1997
Sold by
Hansen Scott M
Bought by
Whinham Mark G
Home Financials for this Owner
Home Financials are based on the most recent Mortgage that was taken out on this home.
Original Mortgage
$126,242
Interest Rate
7.91%
Mortgage Type
FHA
Create a Home Valuation Report for This Property
The Home Valuation Report is an in-depth analysis detailing your home's value as well as a comparison with similar homes in the area
Home Values in the Area
Average Home Value in this Area
Purchase History
| Date | Buyer | Sale Price | Title Company |
|---|---|---|---|
| Vanvu Hoang | -- | First Americna | |
| Abarca Chelsea | -- | Mountain View Title | |
| Marsh Blake K | -- | Mountain View Title | |
| Marsh Blake | -- | Mountain View Title Ogden | |
| Marsh Blake K | -- | Mountain View Title | |
| Whinham Mark | -- | Security Title | |
| Whinham Mark G | -- | Mountain View Title |
Source: Public Records
Mortgage History
| Date | Status | Borrower | Loan Amount |
|---|---|---|---|
| Open | Vanvu Hoang | $350,416 | |
| Previous Owner | Abarca Chelsea | $217,180 | |
| Previous Owner | Marsh Blake K | $195,911 | |
| Previous Owner | Marsh Blake | $175,112 | |
| Previous Owner | Marsh Blake K | $171,000 | |
| Previous Owner | Whinham Mark | $116,800 | |
| Previous Owner | Whinham Mark G | $126,242 | |
| Closed | Whinham Mark | $29,200 |
Source: Public Records
Tax History
| Year | Tax Paid | Tax Assessment Tax Assessment Total Assessment is a certain percentage of the fair market value that is determined by local assessors to be the total taxable value of land and additions on the property. | Land | Improvement |
|---|---|---|---|---|
| 2025 | $2,855 | $456,936 | $135,012 | $321,924 |
| 2024 | $2,730 | $241,449 | $74,256 | $167,193 |
| 2023 | $2,576 | $227,700 | $71,317 | $156,383 |
| 2022 | $2,892 | $265,650 | $60,501 | $205,149 |
| 2021 | $2,300 | $346,000 | $75,002 | $270,998 |
| 2020 | $2,218 | $307,000 | $75,002 | $231,998 |
| 2019 | $2,183 | $285,000 | $49,906 | $235,094 |
| 2018 | $2,032 | $249,000 | $44,976 | $204,024 |
| 2017 | $1,871 | $214,000 | $43,029 | $170,971 |
| 2016 | $1,767 | $108,422 | $24,773 | $83,649 |
| 2015 | $1,582 | $98,839 | $24,773 | $74,066 |
| 2014 | $1,563 | $96,508 | $21,944 | $74,564 |
Source: Public Records
Map
Nearby Homes
- 2815 W 4275 S
- 4374 S 2900 W
- 4270 S 2900 W
- 2979 W 4275 S
- 4297 Westlake Dr
- 2778 W 4175 S Unit 237
- 2892 W 3975 S Unit 40C
- 2673 W 3900 S
- 3077 W 4650 S
- 3022 W 4750 S
- 4732 S West Park Dr
- 4248 S 2400 W
- 4435 Cross Creek Rd Unit 29C
- 3229 W 3855 S
- 3114 S 3175 W Unit 21
- 4510 Stone Creek Rd Unit F
- 3860 S Midland Dr Unit B 51
- 3222 W 3825 S Unit SPL350
- 2602 W 3900 S
- 3763 S 3175 W
Your Personal Tour Guide
Ask me questions while you tour the home.