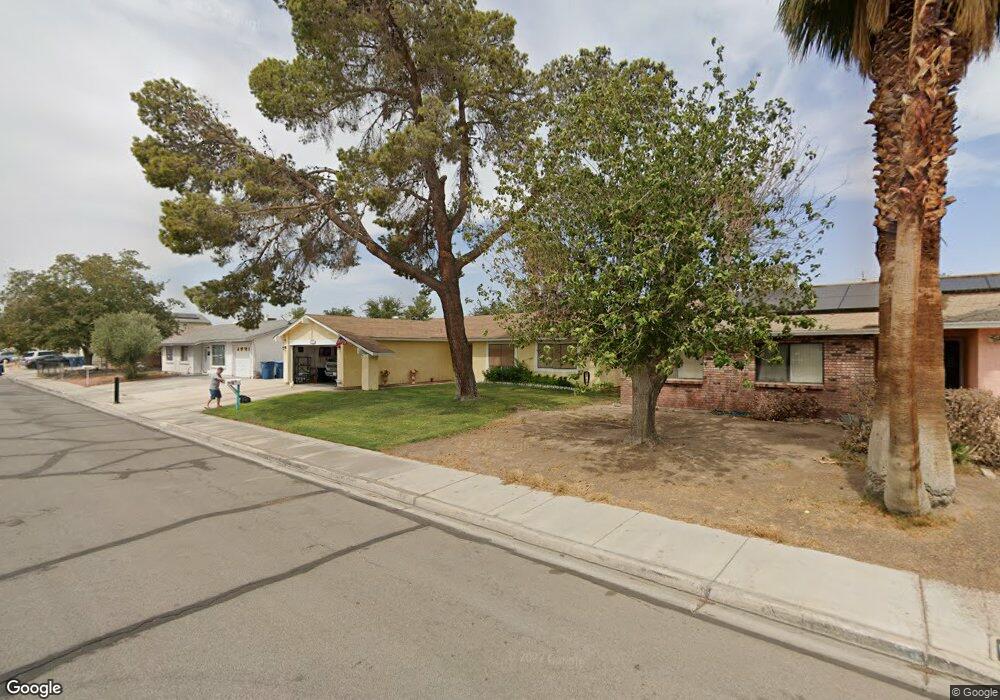
4316 Skyview Dr Las Vegas, NV 89104
Estimated Value: $341,589 - $394,000
4
Beds
2
Baths
1,408
Sq Ft
$262/Sq Ft
Est. Value
About This Home
This home is located at 4316 Skyview Dr, Las Vegas, NV 89104 and is currently estimated at $368,397, approximately $261 per square foot. 4316 Skyview Dr is a home located in Clark County with nearby schools including William E. Snyder Elementary School, Jerome Mack Middle School, and Chaparral High School.
Ownership History
Date
Name
Owned For
Owner Type
Purchase Details
Closed on
Jul 19, 2019
Sold by
Andrini Eric W and Andrini Denise
Bought by
Andrini Eric W and Andrini Denise R
Current Estimated Value
Purchase Details
Closed on
Nov 10, 2003
Sold by
Andrini Eric W
Bought by
Andrini Eric W and Andrini Denise
Home Financials for this Owner
Home Financials are based on the most recent Mortgage that was taken out on this home.
Original Mortgage
$81,220
Interest Rate
5.72%
Mortgage Type
Unknown
Purchase Details
Closed on
Jun 8, 1995
Sold by
Eyler Paul Jay R and Eyler Ilean B
Bought by
Andrini Eric W
Home Financials for this Owner
Home Financials are based on the most recent Mortgage that was taken out on this home.
Original Mortgage
$84,800
Interest Rate
7.88%
Purchase Details
Closed on
Oct 12, 1994
Sold by
Eyler Paul Jay R and Eyler Ilean B
Bought by
Eyler Paul Jay R and Eyler Ilean B
Create a Home Valuation Report for This Property
The Home Valuation Report is an in-depth analysis detailing your home's value as well as a comparison with similar homes in the area
Home Values in the Area
Average Home Value in this Area
Purchase History
| Date | Buyer | Sale Price | Title Company |
|---|---|---|---|
| Andrini Eric W | -- | None Available | |
| Andrini Eric W | -- | North American Title Co | |
| Andrini Eric W | $106,000 | Land Title | |
| Eyler Paul Jay R | -- | -- |
Source: Public Records
Mortgage History
| Date | Status | Borrower | Loan Amount |
|---|---|---|---|
| Closed | Andrini Eric W | $81,220 | |
| Closed | Andrini Eric W | $84,800 |
Source: Public Records
Tax History Compared to Growth
Tax History
| Year | Tax Paid | Tax Assessment Tax Assessment Total Assessment is a certain percentage of the fair market value that is determined by local assessors to be the total taxable value of land and additions on the property. | Land | Improvement |
|---|---|---|---|---|
| 2025 | $760 | $50,164 | $27,300 | $22,864 |
| 2024 | $738 | $50,164 | $27,300 | $22,864 |
| 2023 | $602 | $52,638 | $29,750 | $22,888 |
| 2022 | $717 | $45,872 | $24,500 | $21,372 |
| 2021 | $696 | $41,830 | $21,000 | $20,830 |
| 2020 | $673 | $41,770 | $20,650 | $21,120 |
| 2019 | $653 | $40,532 | $19,250 | $21,282 |
| 2018 | $634 | $36,531 | $15,750 | $20,781 |
| 2017 | $1,038 | $35,391 | $14,000 | $21,391 |
| 2016 | $602 | $32,439 | $10,150 | $22,289 |
| 2015 | $600 | $28,063 | $7,700 | $20,363 |
| 2014 | $582 | $22,002 | $5,600 | $16,402 |
Source: Public Records
Map
Nearby Homes
- 1892 Miner Way
- 4458 Skyview Dr
- 4057 Olive St
- 4496 Skyview Dr
- 4067 E Colorado Ave
- 4324 E Saint Louis Ave
- 4055 E New York Ave
- 4410 E Boston Ave
- 1761 Arden St
- 1485 Arden St
- 4214 E Baltimore Ave
- 4170 E Baltimore Ave
- 45 N Lamb Blvd
- 4590 E Saint Louis Ave
- 2278 Miner Way
- 4280 Hampshire Green Ct
- 3887 Delling Ct
- 4237 Brockton Green Ct
- 4217 Park Ct
- 4213 Essex Green Ct
- 4308 Skyview Dr
- 4326 Skyview Dr
- 4298 Skyview Dr Unit 10
- 4336 Skyview Dr
- 4315 Skyview Dr
- 4307 Skyview Dr
- 4325 Skyview Dr
- 4288 Skyview Dr
- 4346 Skyview Dr
- 4297 Skyview Dr
- 4335 Skyview Dr
- 4280 Skyview Dr
- 4287 Skyview Dr
- 4345 Skyview Dr
- 4356 Skyview Dr
- 4318 Sun Vista Dr
- 4310 Sun Vista Dr
- 4328 Sun Vista Dr
- 4300 Sun Vista Dr
- 4279 Skyview Dr