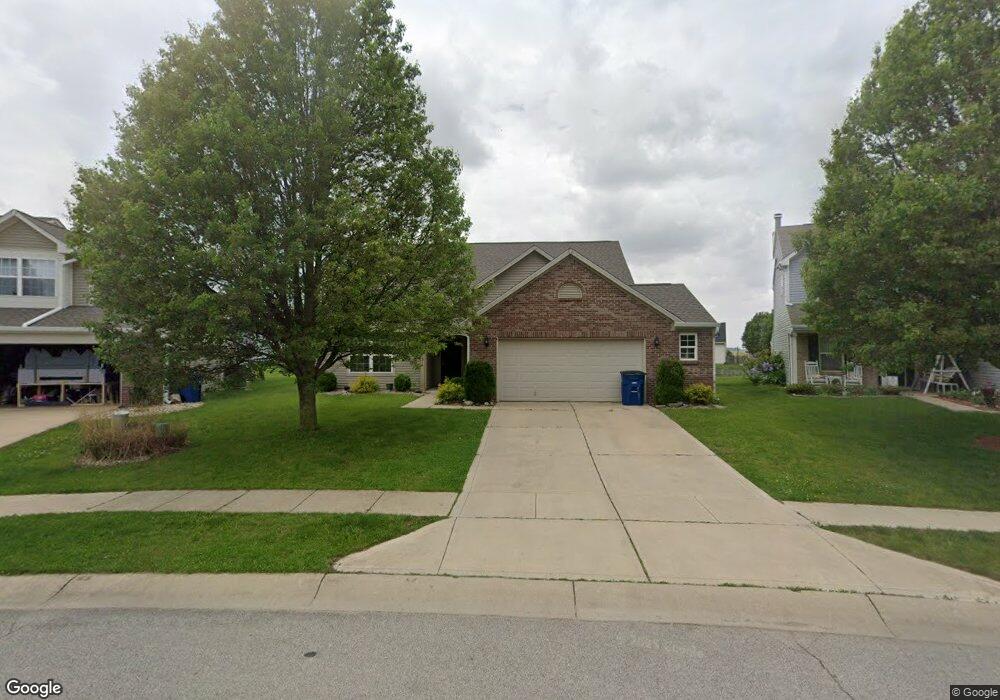
4316 Wildoner Dr Marion, IN 46953
Estimated Value: $227,000 - $251,000
3
Beds
3
Baths
2,092
Sq Ft
$114/Sq Ft
Est. Value
About This Home
This home is located at 4316 Wildoner Dr, Marion, IN 46953 and is currently estimated at $239,162, approximately $114 per square foot. 4316 Wildoner Dr is a home located in Grant County with nearby schools including Frances Slocum Elementary School, John L. McCulloch Junior High School, and Justice Thurgood Marshall Intermediate School.
Ownership History
Date
Name
Owned For
Owner Type
Purchase Details
Closed on
Apr 6, 2021
Sold by
Tuin Lon and Tuin Janice
Bought by
Womack James R and Womack Andrea J
Current Estimated Value
Home Financials for this Owner
Home Financials are based on the most recent Mortgage that was taken out on this home.
Original Mortgage
$134,400
Outstanding Balance
$121,444
Interest Rate
3.05%
Mortgage Type
Stand Alone Refi Refinance Of Original Loan
Estimated Equity
$117,718
Purchase Details
Closed on
Dec 21, 2007
Sold by
Arbor Homes Llc
Bought by
Tuin Lon and Tuin Janice
Home Financials for this Owner
Home Financials are based on the most recent Mortgage that was taken out on this home.
Original Mortgage
$110,000
Interest Rate
6.27%
Mortgage Type
New Conventional
Purchase Details
Closed on
Sep 6, 2007
Sold by
Texmi Llc
Bought by
Arbor Homes Llc
Create a Home Valuation Report for This Property
The Home Valuation Report is an in-depth analysis detailing your home's value as well as a comparison with similar homes in the area
Home Values in the Area
Average Home Value in this Area
Purchase History
| Date | Buyer | Sale Price | Title Company |
|---|---|---|---|
| Womack James R | -- | None Available | |
| Tuin Lon | -- | None Available | |
| Arbor Homes Llc | -- | None Available |
Source: Public Records
Mortgage History
| Date | Status | Borrower | Loan Amount |
|---|---|---|---|
| Open | Womack James R | $134,400 | |
| Previous Owner | Tuin Lon | $110,000 |
Source: Public Records
Tax History Compared to Growth
Tax History
| Year | Tax Paid | Tax Assessment Tax Assessment Total Assessment is a certain percentage of the fair market value that is determined by local assessors to be the total taxable value of land and additions on the property. | Land | Improvement |
|---|---|---|---|---|
| 2024 | $1,926 | $192,600 | $32,000 | $160,600 |
| 2023 | $1,815 | $181,500 | $32,000 | $149,500 |
| 2022 | $1,608 | $160,800 | $28,500 | $132,300 |
| 2021 | $1,465 | $146,500 | $28,500 | $118,000 |
| 2020 | $1,399 | $139,900 | $28,500 | $111,400 |
| 2019 | $1,366 | $136,600 | $28,500 | $108,100 |
| 2018 | $1,328 | $132,800 | $27,000 | $105,800 |
| 2017 | $1,351 | $133,100 | $27,000 | $106,100 |
| 2016 | $1,355 | $136,000 | $27,000 | $109,000 |
| 2014 | $1,369 | $137,500 | $27,000 | $110,500 |
| 2013 | $1,369 | $140,900 | $27,000 | $113,900 |
Source: Public Records
Map
Nearby Homes
- 4317 Wildoner Dr
- 4305 Wildoner Dr
- 4312 Thompson Dr
- 3907 Joshua Dr
- 3820 Shadowbrook Dr
- 401 W 39th St
- 3808 S Carey St
- 4118 S Landess St
- 3416 S Valley Ave
- 3809 S Landess St
- 1612 W 32nd St
- 3640 S Washington St
- 3440 S Selby St
- 5416 S Baldwin Ave
- 3202 S Hamaker St
- 1508 W Glendale Dr
- 3553 S Boots St
- 2906 S Hamaker St
- 2807 S Nebraska St
- 0 Highway 25 Unit 2 21418534
- 4314 Wildoner Dr
- 4318 Wildoner Dr
- 4321 Starkey Dr
- 4312 Wildoner Dr
- 4322 Wildoner Dr
- 4325 Starkey Dr
- 4317 Starkey Dr
- 4329 Starkey Dr
- 4313 Wildoner Dr
- 4313 Starkey Dr
- 4308 Wildoner Dr
- 4333 Starkey Dr
- 4309 Starkey Dr
- 4304 Wildoner Dr
- 4337 Starkey Dr
- 4305 Starkey Dr
- 4316 Thompson Dr
- 4326 Starkey Dr
- 4332 Starkey Dr
- 4226 Wildoner Dr