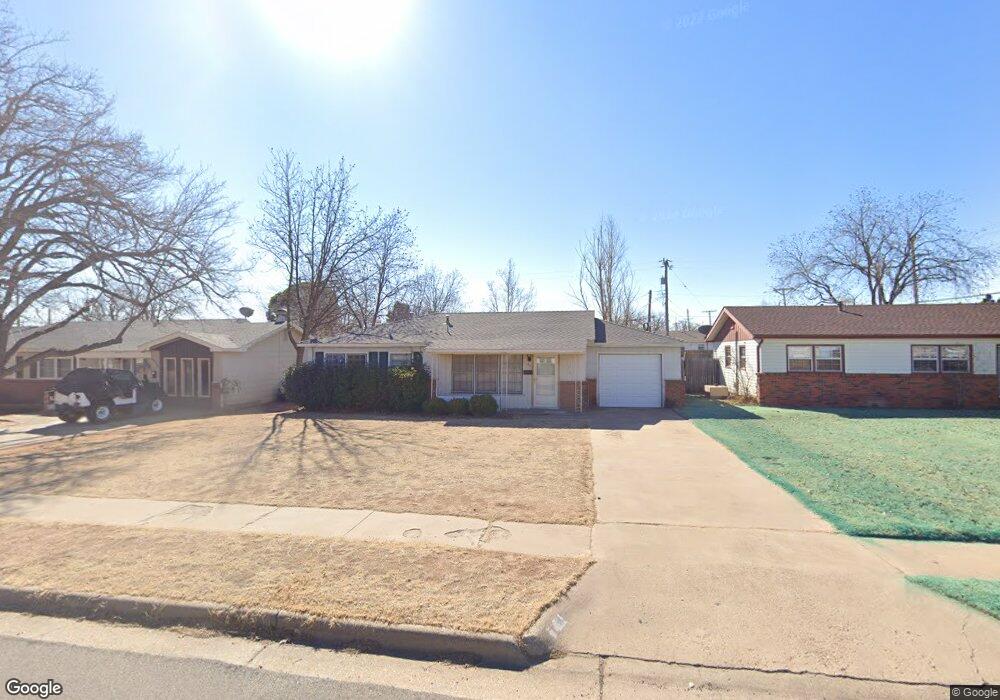
4317 29th St Lubbock, TX 79410
Maxey Park NeighborhoodEstimated Value: $138,000 - $164,000
3
Beds
1
Bath
1,664
Sq Ft
$89/Sq Ft
Est. Value
About This Home
This home is located at 4317 29th St, Lubbock, TX 79410 and is currently estimated at $148,503, approximately $89 per square foot. 4317 29th St is a home located in Lubbock County with nearby schools including Overton Elementary School, Mackenzie Middle School, and Coronado High School.
Ownership History
Date
Name
Owned For
Owner Type
Purchase Details
Closed on
Apr 22, 2009
Sold by
Mitchell Wanda Lou
Bought by
Mitchell Gregory Kenton and Mitchell Brandy Lance
Current Estimated Value
Home Financials for this Owner
Home Financials are based on the most recent Mortgage that was taken out on this home.
Original Mortgage
$15,000
Interest Rate
5.14%
Mortgage Type
New Conventional
Purchase Details
Closed on
Oct 31, 2008
Sold by
Mitchell George K
Bought by
Mitchell Brandy L and Mitchell Gregory K
Create a Home Valuation Report for This Property
The Home Valuation Report is an in-depth analysis detailing your home's value as well as a comparison with similar homes in the area
Home Values in the Area
Average Home Value in this Area
Purchase History
| Date | Buyer | Sale Price | Title Company |
|---|---|---|---|
| Mitchell Gregory Kenton | -- | None Available | |
| Mitchell Brandy L | -- | -- |
Source: Public Records
Mortgage History
| Date | Status | Borrower | Loan Amount |
|---|---|---|---|
| Closed | Mitchell Gregory Kenton | $15,000 |
Source: Public Records
Tax History
| Year | Tax Paid | Tax Assessment Tax Assessment Total Assessment is a certain percentage of the fair market value that is determined by local assessors to be the total taxable value of land and additions on the property. | Land | Improvement |
|---|---|---|---|---|
| 2025 | $1,450 | $141,731 | $23,000 | $118,731 |
| 2024 | $24 | $138,097 | $23,000 | $115,097 |
| 2023 | $2,195 | $118,071 | $10,980 | $107,091 |
| 2022 | $2,173 | $107,337 | $10,980 | $98,740 |
| 2021 | $2,090 | $97,579 | $10,980 | $103,390 |
| 2020 | $1,929 | $88,708 | $10,980 | $77,728 |
| 2019 | $1,810 | $80,644 | $10,980 | $69,664 |
| 2018 | $1,967 | $87,505 | $10,980 | $76,525 |
| 2017 | $1,813 | $80,562 | $10,980 | $69,582 |
| 2016 | $1,648 | $73,238 | $10,980 | $62,258 |
| 2015 | $1,442 | $73,066 | $10,980 | $62,086 |
| 2014 | $1,442 | $73,177 | $5,400 | $67,777 |
Source: Public Records
Map
Nearby Homes
Your Personal Tour Guide
Ask me questions while you tour the home.