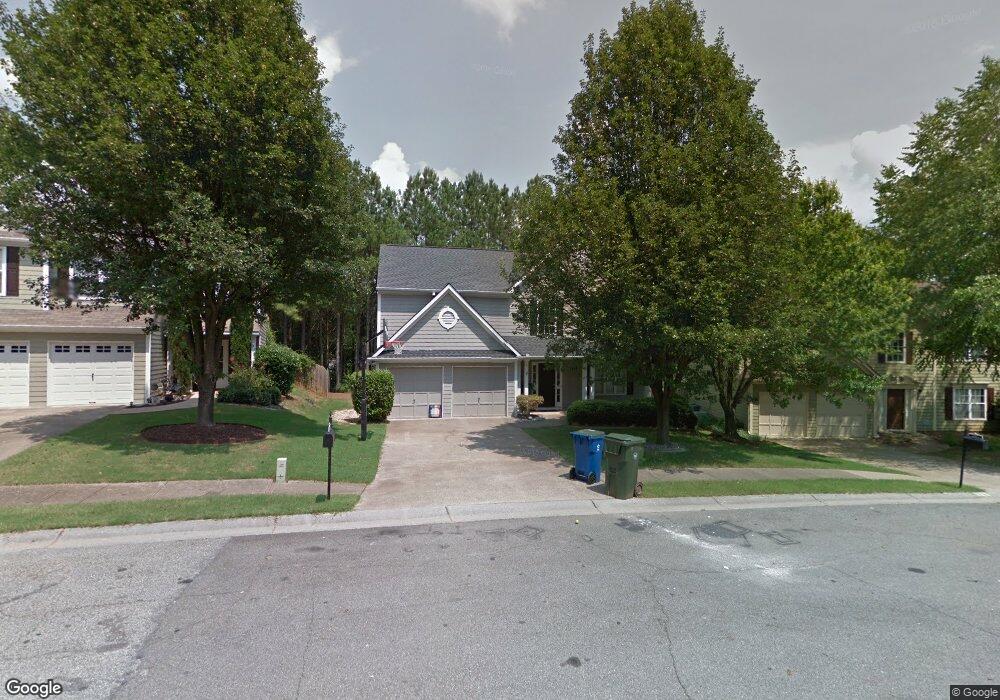
4317 Brighton Way NW Kennesaw, GA 30144
Estimated Value: $425,288 - $455,000
4
Beds
3
Baths
2,286
Sq Ft
$193/Sq Ft
Est. Value
About This Home
This home is located at 4317 Brighton Way NW, Kennesaw, GA 30144 and is currently estimated at $440,322, approximately $192 per square foot. 4317 Brighton Way NW is a home located in Cobb County with nearby schools including Kennesaw Elementary School, Big Shanty Elementary School, and Awtrey Middle School.
Ownership History
Date
Name
Owned For
Owner Type
Purchase Details
Closed on
Jun 25, 2010
Sold by
Hussain Lisa F
Bought by
Hussain Tariq I
Current Estimated Value
Home Financials for this Owner
Home Financials are based on the most recent Mortgage that was taken out on this home.
Original Mortgage
$193,584
Interest Rate
4.92%
Mortgage Type
FHA
Purchase Details
Closed on
Aug 27, 2003
Sold by
Johnson Richard O and Johnson Patricia H
Bought by
Hussain Tariq I and Hussain Lisa
Home Financials for this Owner
Home Financials are based on the most recent Mortgage that was taken out on this home.
Original Mortgage
$168,400
Interest Rate
5.94%
Mortgage Type
FHA
Purchase Details
Closed on
Sep 23, 1996
Sold by
S G Torrey Atlanta Ltd
Bought by
Johnson Richard O Patricia
Create a Home Valuation Report for This Property
The Home Valuation Report is an in-depth analysis detailing your home's value as well as a comparison with similar homes in the area
Home Values in the Area
Average Home Value in this Area
Purchase History
| Date | Buyer | Sale Price | Title Company |
|---|---|---|---|
| Hussain Tariq I | -- | -- | |
| Hussain Tariq I | $169,900 | -- | |
| Johnson Richard O Patricia | $135,000 | -- |
Source: Public Records
Mortgage History
| Date | Status | Borrower | Loan Amount |
|---|---|---|---|
| Previous Owner | Hussain Tariq I | $193,584 | |
| Previous Owner | Hussain Tariq I | $168,400 | |
| Closed | Johnson Richard O Patricia | $0 |
Source: Public Records
Tax History Compared to Growth
Tax History
| Year | Tax Paid | Tax Assessment Tax Assessment Total Assessment is a certain percentage of the fair market value that is determined by local assessors to be the total taxable value of land and additions on the property. | Land | Improvement |
|---|---|---|---|---|
| 2025 | $4,021 | $175,260 | $34,000 | $141,260 |
| 2024 | $4,024 | $175,260 | $34,000 | $141,260 |
| 2023 | $2,860 | $146,596 | $24,000 | $122,596 |
| 2022 | $3,430 | $146,596 | $24,000 | $122,596 |
| 2021 | $2,546 | $106,240 | $24,000 | $82,240 |
| 2020 | $3,088 | $102,576 | $24,000 | $78,576 |
| 2019 | $2,392 | $99,172 | $24,000 | $75,172 |
| 2018 | $2,178 | $89,420 | $24,000 | $65,420 |
| 2017 | $1,805 | $75,792 | $16,000 | $59,792 |
| 2016 | $1,808 | $75,792 | $16,000 | $59,792 |
| 2015 | $1,757 | $71,660 | $16,000 | $55,660 |
| 2014 | $1,770 | $71,660 | $0 | $0 |
Source: Public Records
Map
Nearby Homes
- 2698 Claredon Trace NW
- 4198 Gramercy Main NW
- 4210 Steeplehill Dr NW
- 4157 Berkeley Landing NW
- 4476 High Gate Ct NW
- 3038 Fairhaven Ridge NW
- 4317 Chesapeake Trace NW
- 4344 Thorngate Ln
- 4321 Clairesbrook Ln
- 4336 Thorngate Ln
- 2773 Northgate Way NW Unit 1
- 4851 Lake Park Ln
- 4591 Grenadine Cir
- 2617 Lake Park Bend
- 2693 Blairsden Place NW
- 3324 Whitmore Ct
- 3966 Lullwater Main NW
- 4561 Grenadine Cir
- 4315 Brighton Way NW
- 4319 Brighton Way NW
- 4263 Revere Walk NW
- 4265 Revere Walk NW
- 4261 Revere Walk NW
- 2809 Amhurst Way NW
- 4267 Revere Walk NW
- 4267 Revere Walk NW Unit 3B
- 4269 Revere Walk NW
- 4321 Brighton Way NW
- 2807 Amhurst Way NW
- 4271 Revere Walk NW
- 4320 Brighton Way NW
- 4318 Brighton Way NW
- 4322 Brighton Way NW
- 4259 Revere Walk NW
- 2805 Amhurst Way NW
- 2803 Amhurst Way NW
- 4212 Highcroft Main NW
- 2808 Amhurst Way NW Unit 3A