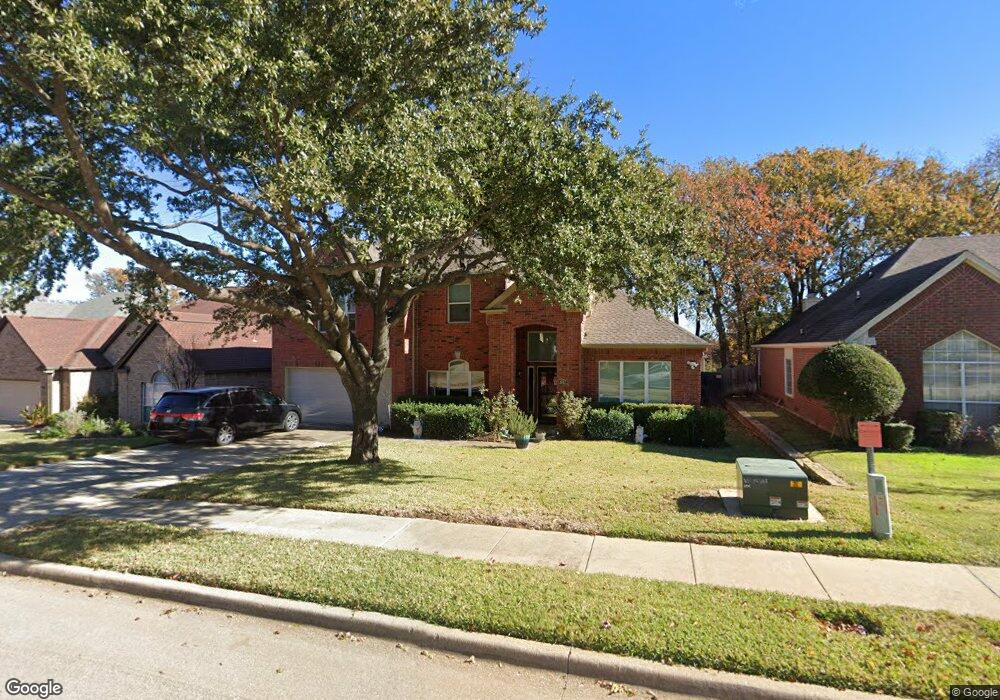
4317 Hazy Meadow Ln Grapevine, TX 76051
Estimated Value: $611,155 - $662,000
4
Beds
3
Baths
2,964
Sq Ft
$214/Sq Ft
Est. Value
About This Home
This home is located at 4317 Hazy Meadow Ln, Grapevine, TX 76051 and is currently estimated at $635,539, approximately $214 per square foot. 4317 Hazy Meadow Ln is a home located in Tarrant County with nearby schools including Grapevine Elementary School, Heritage Middle School, and Holy Trinity Catholic School.
Ownership History
Date
Name
Owned For
Owner Type
Purchase Details
Closed on
Feb 12, 2016
Sold by
Liu Changdong and Li Yanjiao
Bought by
Schmidt David G and Schmidt Bonnie L
Current Estimated Value
Home Financials for this Owner
Home Financials are based on the most recent Mortgage that was taken out on this home.
Original Mortgage
$68,000
Outstanding Balance
$29,315
Interest Rate
3.97%
Mortgage Type
New Conventional
Estimated Equity
$606,224
Purchase Details
Closed on
Mar 28, 2002
Sold by
Park Yang Wook and Park Tina R
Bought by
Liu Changdong
Home Financials for this Owner
Home Financials are based on the most recent Mortgage that was taken out on this home.
Original Mortgage
$186,000
Interest Rate
6.78%
Purchase Details
Closed on
Aug 12, 1994
Sold by
Pulte Home Corp Of Texas
Bought by
Park Yang Wook and Park Tina R
Home Financials for this Owner
Home Financials are based on the most recent Mortgage that was taken out on this home.
Original Mortgage
$164,550
Interest Rate
8.66%
Create a Home Valuation Report for This Property
The Home Valuation Report is an in-depth analysis detailing your home's value as well as a comparison with similar homes in the area
Home Values in the Area
Average Home Value in this Area
Purchase History
| Date | Buyer | Sale Price | Title Company |
|---|---|---|---|
| Schmidt David G | -- | Itc | |
| Liu Changdong | -- | -- | |
| Park Yang Wook | -- | First American Title Co |
Source: Public Records
Mortgage History
| Date | Status | Borrower | Loan Amount |
|---|---|---|---|
| Open | Schmidt David G | $68,000 | |
| Previous Owner | Liu Changdong | $186,000 | |
| Previous Owner | Park Yang Wook | $164,550 |
Source: Public Records
Tax History Compared to Growth
Tax History
| Year | Tax Paid | Tax Assessment Tax Assessment Total Assessment is a certain percentage of the fair market value that is determined by local assessors to be the total taxable value of land and additions on the property. | Land | Improvement |
|---|---|---|---|---|
| 2025 | $2,014 | $564,893 | $93,650 | $471,243 |
| 2024 | $2,014 | $564,893 | $93,650 | $471,243 |
| 2023 | $7,540 | $489,768 | $93,650 | $396,118 |
| 2022 | $8,100 | $464,079 | $93,650 | $370,429 |
| 2021 | $8,082 | $371,700 | $75,000 | $296,700 |
| 2020 | $8,590 | $390,521 | $75,000 | $315,521 |
| 2019 | $8,941 | $392,071 | $75,000 | $317,071 |
| 2018 | $2,134 | $358,896 | $75,000 | $283,896 |
| 2017 | $8,237 | $356,197 | $75,000 | $281,197 |
| 2016 | $7,637 | $346,003 | $75,000 | $271,003 |
| 2015 | $5,942 | $300,208 | $60,000 | $240,208 |
| 2014 | $5,942 | $316,000 | $28,000 | $288,000 |
Source: Public Records
Map
Nearby Homes
- 709 Wortham Dr
- 1907 New Haven Rd
- 1917 Waterford Dr
- 4360 Bradford Dr
- 1803 Haydenbend Cir
- 1819 Haydenbend Cir
- 3602 Soft Wind Ct
- 516 Briarcroft Dr
- 4810 Trevor Trail
- 3601 William D Tate Ave
- 3005 Roxboro Rd
- 2849 Timber Hill Dr
- 4105 Williams Ct
- 3200 Magnolia Ct
- 2922 Hilltop Dr
- 326 Park Hill Ln
- 709 Normandy Dr
- 3908 Heritage Oaks Dr
- 2704 Yorkshire Ct
- 3826 Shady Meadow Dr
- 4319 Hazy Meadow Ln
- 4315 Hazy Meadow Ln
- 717 Bear Run Dr
- 4313 Hazy Meadow Ln
- 719 Bear Run Dr
- 721 Bear Run Dr
- 715 Bear Run Dr
- 4310 Hazy Meadow Ln
- 4325 Hazy Meadow Ln
- 4308 Hazy Meadow Ln
- 4311 Hazy Meadow Ln
- 4312 Hazy Meadow Ln
- 723 Bear Run Dr
- 4306 Hazy Meadow Ln
- 4314 Hazy Meadow Ln
- 4327 Hazy Meadow Ln
- 4309 Hazy Meadow Ln
- 713 Sabel Ridge Ln
- 710 Sabel Ridge Ln
- 725 Bear Run Dr