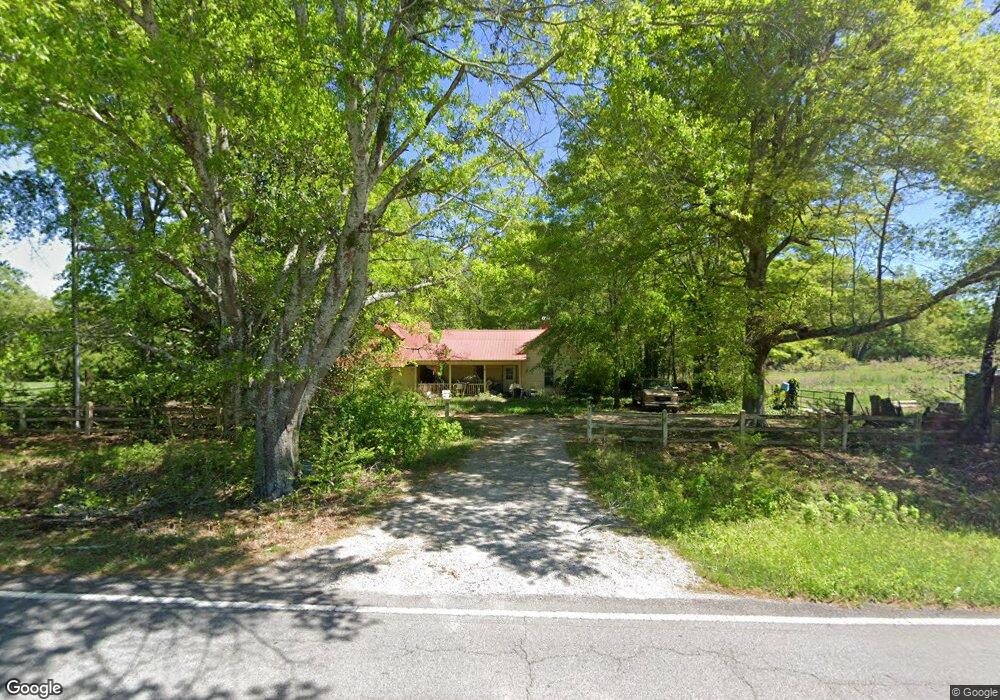
4317 S Hickory Level Rd Carrollton, GA 30116
Abilene NeighborhoodEstimated Value: $281,000 - $734,273
2
Beds
1
Bath
1,270
Sq Ft
$372/Sq Ft
Est. Value
About This Home
This home is located at 4317 S Hickory Level Rd, Carrollton, GA 30116 and is currently estimated at $472,758, approximately $372 per square foot. 4317 S Hickory Level Rd is a home located in Carroll County with nearby schools including Ithica Elementary School, Bay Springs Middle School, and Villa Rica High School.
Ownership History
Date
Name
Owned For
Owner Type
Purchase Details
Closed on
Mar 1, 2012
Sold by
Shackleford Family Llc
Bought by
Shackleford Family Llc
Current Estimated Value
Purchase Details
Closed on
Nov 21, 2011
Sold by
Shackleford Benjamin A
Purchase Details
Closed on
Feb 5, 2008
Sold by
Shackleford Elizabeth A
Bought by
Shackleford Elizabeth A and Shackleford Benjamin Harold
Purchase Details
Closed on
Mar 1, 1993
Sold by
Shackleford Benjamin H
Bought by
Shackleford Benjamin H and Shackleford Betty A
Purchase Details
Closed on
Jan 29, 1993
Sold by
Morgan Zellie and Morgan Madelyn S
Bought by
Shackleford Benjamin H and Shackleford Betty A
Purchase Details
Closed on
Jul 26, 1991
Sold by
Humphries Sam
Bought by
Shackleford Benjamin H
Purchase Details
Closed on
May 22, 1991
Sold by
Shackleford Bennie F Estate
Bought by
Shackleford Benjamin H and Shackleford Betty A
Create a Home Valuation Report for This Property
The Home Valuation Report is an in-depth analysis detailing your home's value as well as a comparison with similar homes in the area
Home Values in the Area
Average Home Value in this Area
Purchase History
| Date | Buyer | Sale Price | Title Company |
|---|---|---|---|
| Shackleford Family Llc | -- | -- | |
| -- | -- | -- | |
| Shackleford Benjamin A | -- | -- | |
| Shackleford Benjamin A | -- | -- | |
| Shackleford Elizabeth A | -- | -- | |
| Shackleford Elizabeth A | -- | -- | |
| Shackleford Elizabeth A | -- | -- | |
| Shackleford Benjamin H | -- | -- | |
| Shackleford Benjamin H | $20,500 | -- | |
| Shackleford Benjamin H | $19,300 | -- | |
| Shackleford Benjamin H | $125,100 | -- |
Source: Public Records
Tax History Compared to Growth
Tax History
| Year | Tax Paid | Tax Assessment Tax Assessment Total Assessment is a certain percentage of the fair market value that is determined by local assessors to be the total taxable value of land and additions on the property. | Land | Improvement |
|---|---|---|---|---|
| 2024 | $4,033 | $178,280 | $137,345 | $40,935 |
| 2023 | $3,482 | $147,111 | $109,876 | $37,235 |
| 2022 | $2,592 | $103,364 | $73,250 | $30,114 |
| 2021 | $2,165 | $84,437 | $58,600 | $25,837 |
| 2020 | $1,958 | $76,277 | $53,272 | $23,005 |
| 2019 | $1,941 | $75,008 | $53,272 | $21,736 |
| 2018 | $978 | $73,492 | $53,272 | $20,220 |
| 2017 | $968 | $73,492 | $53,272 | $20,220 |
| 2016 | $956 | $73,492 | $53,272 | $20,220 |
| 2015 | $1,137 | $70,632 | $45,568 | $25,065 |
| 2014 | $1,129 | $70,632 | $45,568 | $25,065 |
Source: Public Records
Map
Nearby Homes
- 415 Paynes Lake Rd
- 0 Paynes Lake Rd Unit 7339831
- 0 Paynes Lake Rd Unit 10254856
- 577 W Hickory Level Rd
- 56 Dahlia Ct
- 2020 Carrollton Hwy
- 59 Tulip Way
- 0 Roy Morgan Rd Unit 17.44 ACRES
- 160 & 168 Roy Morgan Rd
- 0 Roy Morgan Rd Unit 7671946
- 301 Spruill Bridge Rd
- 472 Price Rd
- 160 Old Sandhill Rd
- 352 Price Rd
- 3279 Shady Grove Rd
- 382 Price Rd
- 252 Spruill Bridge Rd
- 183 Muse Bridge Rd
- 0
- 1620 Bar J Rd
- 4314 S Hickory Level Rd
- 4361 S Hickory Level Rd
- 4361 S Hickory Level Rd
- 4361 S Hickory Level Rd
- S S Hickory Level Rd Unit 5
- S S Hickory Level Rd
- 4401 S Hickory Level Rd Unit 5
- 4401 S Hickory Level Rd
- 4300 S Hickory Level Rd
- 4410 S Hickory Level Rd
- 110 Humphries Dr
- 44 Humphries Dr
- 4137 Shady Grove Rd
- 101 Humphries Dr
- 107 Humphries Dr
- 115 Humphries Dr
- 4255 S Hickory Level Rd
- 4260 S Hickory Level Rd
- 0 Humphries Dr
- 0 Humphries Dr Unit 7294138