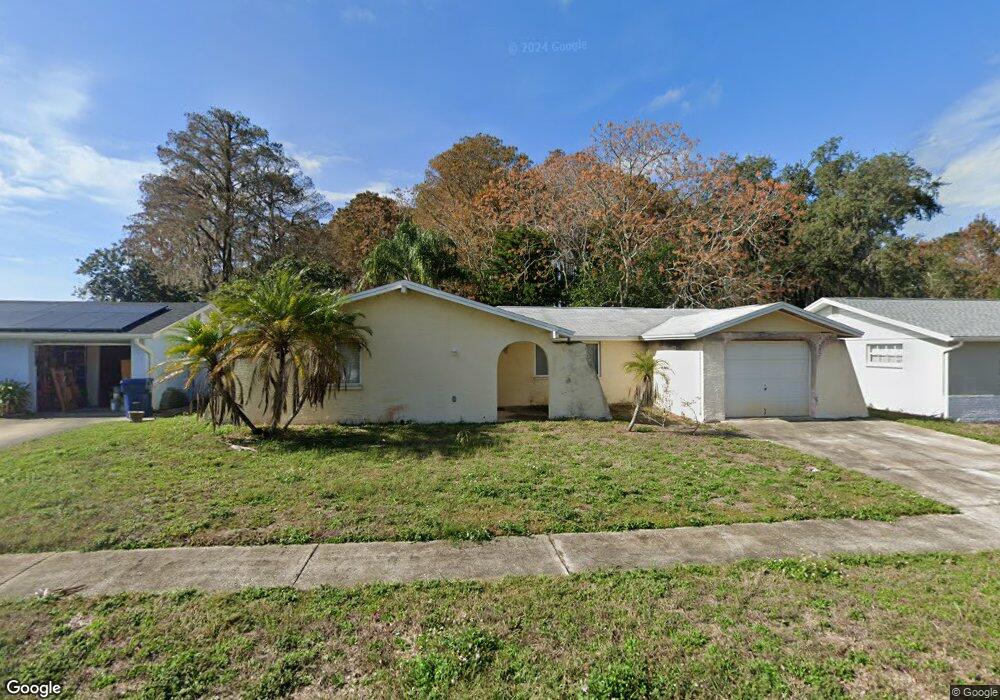
4319 Crestwood Blvd New Port Richey, FL 34653
Seven Springs NeighborhoodEstimated Value: $240,000 - $279,509
3
Beds
2
Baths
1,941
Sq Ft
$133/Sq Ft
Est. Value
About This Home
This home is located at 4319 Crestwood Blvd, New Port Richey, FL 34653 and is currently estimated at $257,377, approximately $132 per square foot. 4319 Crestwood Blvd is a home located in Pasco County with nearby schools including Cotee River Elementary School, Gulf Middle School, and Gulf High School.
Ownership History
Date
Name
Owned For
Owner Type
Purchase Details
Closed on
Nov 25, 2013
Sold by
Hsbc Bak Usa National Association
Bought by
Boiadja Svetlana and Staykov Boyan
Current Estimated Value
Purchase Details
Closed on
Sep 23, 2013
Sold by
Cross Sonya M
Bought by
Hsbc Bank Usa National Association
Purchase Details
Closed on
Apr 26, 2005
Sold by
Kelly Richard and Kelly Karen
Bought by
Cross Sonya M
Home Financials for this Owner
Home Financials are based on the most recent Mortgage that was taken out on this home.
Original Mortgage
$143,900
Interest Rate
7.1%
Mortgage Type
Fannie Mae Freddie Mac
Purchase Details
Closed on
Sep 9, 1999
Sold by
Sobel David C and Kelley-Sobel Janet
Bought by
Kelly Richard and Kelly Karen
Home Financials for this Owner
Home Financials are based on the most recent Mortgage that was taken out on this home.
Original Mortgage
$61,600
Interest Rate
7.73%
Mortgage Type
New Conventional
Create a Home Valuation Report for This Property
The Home Valuation Report is an in-depth analysis detailing your home's value as well as a comparison with similar homes in the area
Home Values in the Area
Average Home Value in this Area
Purchase History
| Date | Buyer | Sale Price | Title Company |
|---|---|---|---|
| Boiadja Svetlana | $35,408 | Premium Title Services Inc | |
| Hsbc Bank Usa National Association | $2,100 | None Available | |
| Cross Sonya M | $179,900 | Westshore Title Services Inc | |
| Kelly Richard | $77,000 | -- |
Source: Public Records
Mortgage History
| Date | Status | Borrower | Loan Amount |
|---|---|---|---|
| Previous Owner | Cross Sonya M | $143,900 | |
| Previous Owner | Kelly Richard | $86,400 | |
| Previous Owner | Kelly Richard | $61,600 |
Source: Public Records
Tax History Compared to Growth
Tax History
| Year | Tax Paid | Tax Assessment Tax Assessment Total Assessment is a certain percentage of the fair market value that is determined by local assessors to be the total taxable value of land and additions on the property. | Land | Improvement |
|---|---|---|---|---|
| 2025 | $3,324 | $237,493 | $37,919 | $199,574 |
| 2024 | $3,324 | $237,676 | $35,169 | $202,507 |
| 2023 | $3,174 | $135,890 | $0 | $0 |
| 2022 | $2,528 | $190,703 | $24,664 | $166,039 |
| 2021 | $2,201 | $146,485 | $22,133 | $124,352 |
| 2020 | $1,971 | $125,211 | $12,226 | $112,985 |
| 2019 | $1,856 | $118,550 | $12,226 | $106,324 |
| 2018 | $1,720 | $109,705 | $12,226 | $97,479 |
| 2017 | $1,504 | $83,237 | $11,401 | $71,836 |
| 2016 | $1,322 | $69,737 | $11,401 | $58,336 |
| 2015 | $876 | $42,408 | $11,401 | $31,007 |
| 2014 | $787 | $38,208 | $10,576 | $27,632 |
Source: Public Records
Map
Nearby Homes
- 6743 Knightsbridge Dr
- 6653 Albemarle Pkwy
- 6646 Albemarle Pkwy
- 4155 Pine Haven Rd
- 4035 Thys Rd
- 0 State Road 54 Unit MFRW7861280
- 6520 Thicket Trail
- 6514 Thicket Trail
- 6519 Thicket Trail
- 6516 Remus Dr
- 6506 Remus Dr
- 6420 Cabbage Ln
- 6505 Remus Dr
- 6428 Thicket Trail
- 6424 Thicket Trail
- 4113 Savage Station Cir
- 6342 Butte Ave
- Lot 16 Riverrun Rd
- 6432 Remus Dr
- 6425 Thicket Trail
- 4325 Crestwood Blvd
- 4311 Crestwood Blvd
- 4333 Crestwood Blvd
- 4316 Crestwood Blvd
- 6751 Albemarle Pkwy
- 4310 Crestwood Blvd
- 4324 Crestwood Blvd
- 6743 Albemarle Pkwy
- 4304 Crestwood Blvd
- 4304 4304 Crestwood Blvd
- 4330 Crestwood Blvd
- 6737 Albemarle Pkwy
- 4339 Crestwood Blvd
- 4252 Crestwood Blvd
- 6731 Albemarle Pkwy
- 4246 Crestwood Blvd
- 6725 Albemarle Pkwy
- 6750 Albemarle Pkwy
- 6742 Albemarle Pkwy
- 6736 Albemarle Pkwy