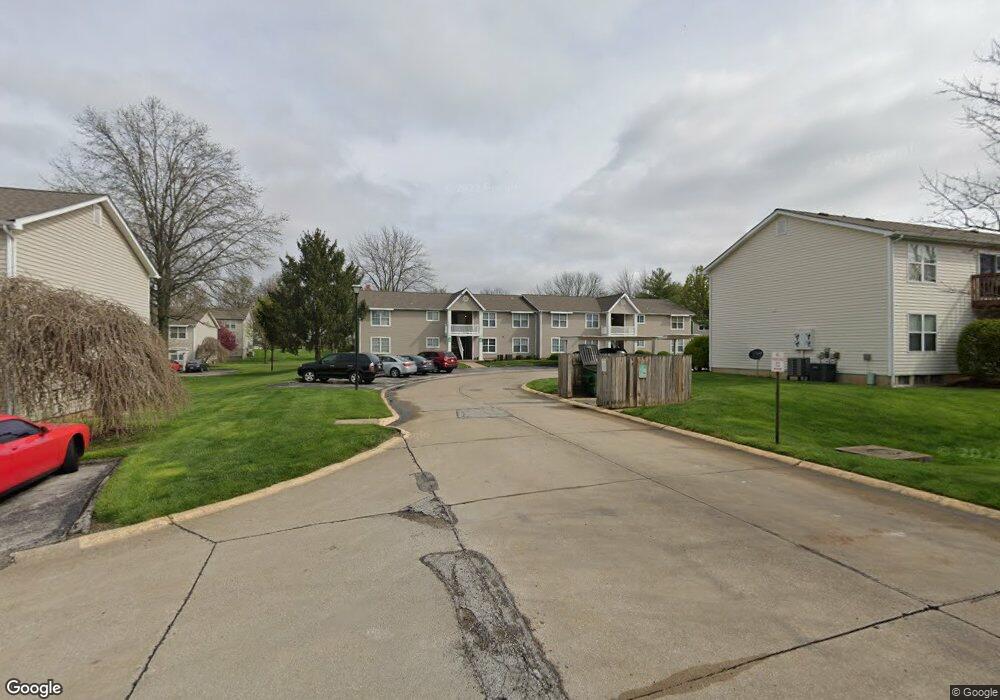
4319 Inlet Isle Dr Unit 5 Florissant, MO 63034
Estimated Value: $103,217 - $114,000
2
Beds
2
Baths
1,044
Sq Ft
$102/Sq Ft
Est. Value
About This Home
This home is located at 4319 Inlet Isle Dr Unit 5, Florissant, MO 63034 and is currently estimated at $106,304, approximately $101 per square foot. 4319 Inlet Isle Dr Unit 5 is a home located in St. Louis County with nearby schools including Jana Elementary School, North Middle School, and Hazelwood Central High School.
Ownership History
Date
Name
Owned For
Owner Type
Purchase Details
Closed on
Jan 3, 2020
Sold by
River Oaks Condominium Association
Bought by
Jones Mark
Current Estimated Value
Purchase Details
Closed on
Oct 22, 2019
Sold by
Jones Mark
Bought by
River Oaks Condominium Association
Purchase Details
Closed on
Jul 7, 2005
Sold by
Miller James A and Miller Norma J
Bought by
Jones Mark
Home Financials for this Owner
Home Financials are based on the most recent Mortgage that was taken out on this home.
Original Mortgage
$66,300
Interest Rate
8.9%
Mortgage Type
Fannie Mae Freddie Mac
Purchase Details
Closed on
Sep 3, 2002
Sold by
Miller James A and Miller Norma J
Bought by
Miller James A and Miller Norma J
Home Financials for this Owner
Home Financials are based on the most recent Mortgage that was taken out on this home.
Original Mortgage
$40,000
Interest Rate
6.2%
Create a Home Valuation Report for This Property
The Home Valuation Report is an in-depth analysis detailing your home's value as well as a comparison with similar homes in the area
Home Values in the Area
Average Home Value in this Area
Purchase History
| Date | Buyer | Sale Price | Title Company |
|---|---|---|---|
| Jones Mark | $12,500 | None Available | |
| River Oaks Condominium Association | $10,215 | None Available | |
| Jones Mark | $78,000 | Fa | |
| Miller James A | -- | -- |
Source: Public Records
Mortgage History
| Date | Status | Borrower | Loan Amount |
|---|---|---|---|
| Previous Owner | Jones Mark | $66,300 | |
| Previous Owner | Miller James A | $40,000 |
Source: Public Records
Tax History Compared to Growth
Tax History
| Year | Tax Paid | Tax Assessment Tax Assessment Total Assessment is a certain percentage of the fair market value that is determined by local assessors to be the total taxable value of land and additions on the property. | Land | Improvement |
|---|---|---|---|---|
| 2025 | $1,476 | $18,690 | $2,770 | $15,920 |
| 2024 | $1,476 | $16,490 | $1,290 | $15,200 |
| 2023 | $1,471 | $16,490 | $1,290 | $15,200 |
| 2022 | $1,242 | $12,390 | $1,480 | $10,910 |
| 2021 | $1,174 | $12,390 | $1,480 | $10,910 |
| 2020 | $1,293 | $12,710 | $1,880 | $10,830 |
| 2019 | $1,282 | $12,710 | $1,880 | $10,830 |
| 2018 | $1,151 | $10,550 | $990 | $9,560 |
| 2017 | $1,150 | $10,550 | $990 | $9,560 |
| 2016 | $1,219 | $11,000 | $1,880 | $9,120 |
| 2015 | $1,172 | $11,000 | $1,880 | $9,120 |
| 2014 | $1,349 | $12,600 | $1,880 | $10,720 |
Source: Public Records
Map
Nearby Homes
- 4328 Inlet Isle Dr
- 4304 Inlet Isle Dr Unit 7
- 4227 River Oaks Dr
- 14333 River Oaks Ct
- 14234 Ashbury Meadows Dr
- 14214 Ashbury Meadows Dr
- 3703 Candlewyck Club Dr Unit D
- 101 Robbins Way Dr
- 14122 Candlewyck Place Ct
- 3707 Candlewyck Club Dr Unit C
- 3614 Candlewyck Club Dr Unit E
- 14663 Rouvre Dr
- 144 Carytown Ln
- 3860 Belcroft Dr
- 4361 Old Jamestown Winery Rd
- 3722 Candlewyck Club Dr Unit D
- 3230 Churchill Dr
- 210 Behlmann Meadows Way
- 13630 Old Halls Ferry Rd
- 3092 Wintergreen Dr
- 4323 Inlet Isle Dr Unit 6
- 4315 Inlet Isle Dr Unit 4
- 4327 Inlet Isle Dr
- 4311 Inlet Isle Dr Unit 3
- 4331 Inlet Isle Dr
- 4303 Inlet Isle Dr Unit 1
- 4307 Inlet Isle Dr
- 14228 Cape Horn Place Unit 2
- 14224 Cape Horn Place
- 14232 Cape Horn Place
- 14232 Cape Horn Place Unit 3
- 4324 Inlet Isle Dr
- 4320 Inlet Isle Dr Unit 3
- 14236 Cape Horn Place
- 4312 Inlet Isle Dr Unit 5
- 4308 Inlet Isle Dr Unit 6
- 14240 Cape Horn Place Unit 5
- 4300 Inlet Isle Dr Unit 8
- 4231 Gulf Shore E
- 14231 Cape Horn Place