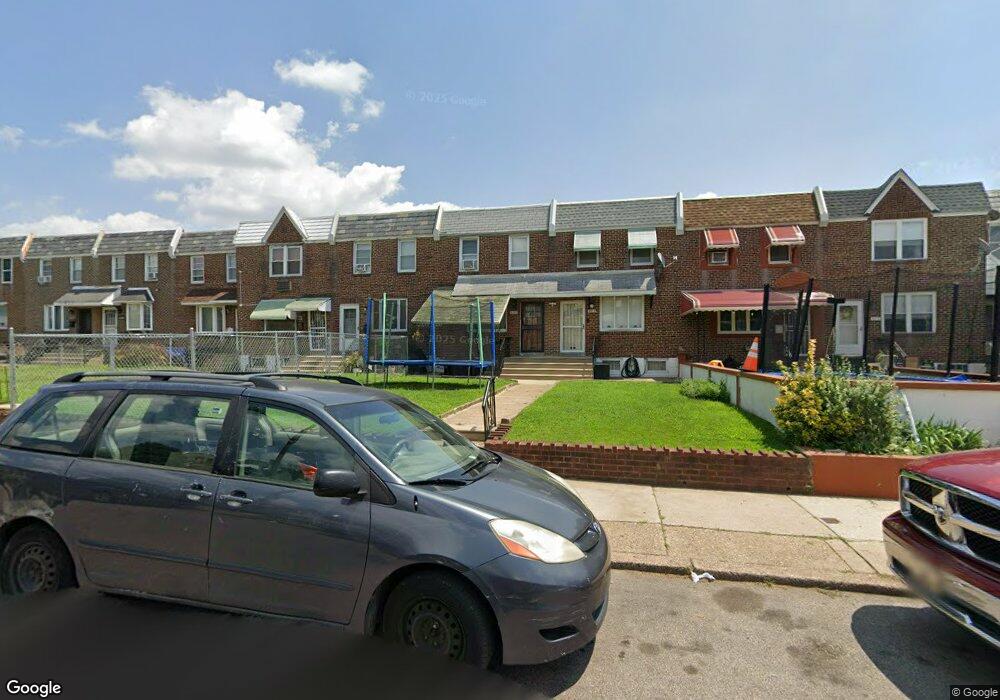
4319 Malta St Philadelphia, PA 19124
Juniata Park NeighborhoodEstimated Value: $203,000 - $233,000
3
Beds
1
Bath
1,120
Sq Ft
$192/Sq Ft
Est. Value
About This Home
This home is located at 4319 Malta St, Philadelphia, PA 19124 and is currently estimated at $214,763, approximately $191 per square foot. 4319 Malta St is a home located in Philadelphia County with nearby schools including Frankford High School, Community Academy of Philadelphia CS, and Holy Innocents Area Catholic Elementary School.
Ownership History
Date
Name
Owned For
Owner Type
Purchase Details
Closed on
Sep 19, 2003
Sold by
Rivera Maribel
Bought by
Santiago Eddie and Rivera Maribel
Current Estimated Value
Home Financials for this Owner
Home Financials are based on the most recent Mortgage that was taken out on this home.
Original Mortgage
$67,450
Interest Rate
5.89%
Mortgage Type
New Conventional
Purchase Details
Closed on
Apr 15, 2002
Sold by
Rieser Maureen and Stewart Wanda
Bought by
Rivera Maribel
Home Financials for this Owner
Home Financials are based on the most recent Mortgage that was taken out on this home.
Original Mortgage
$58,900
Interest Rate
6.85%
Create a Home Valuation Report for This Property
The Home Valuation Report is an in-depth analysis detailing your home's value as well as a comparison with similar homes in the area
Home Values in the Area
Average Home Value in this Area
Purchase History
| Date | Buyer | Sale Price | Title Company |
|---|---|---|---|
| Santiago Eddie | -- | Commonwealth Title | |
| Rivera Maribel | $62,000 | -- |
Source: Public Records
Mortgage History
| Date | Status | Borrower | Loan Amount |
|---|---|---|---|
| Previous Owner | Santiago Eddie | $67,450 | |
| Previous Owner | Rivera Maribel | $58,900 |
Source: Public Records
Tax History Compared to Growth
Tax History
| Year | Tax Paid | Tax Assessment Tax Assessment Total Assessment is a certain percentage of the fair market value that is determined by local assessors to be the total taxable value of land and additions on the property. | Land | Improvement |
|---|---|---|---|---|
| 2025 | $2,275 | $186,600 | $37,320 | $149,280 |
| 2024 | $2,275 | $186,600 | $37,320 | $149,280 |
| 2023 | $2,275 | $162,500 | $32,500 | $130,000 |
| 2022 | $1,705 | $162,500 | $32,500 | $130,000 |
| 2021 | $1,705 | $0 | $0 | $0 |
| 2020 | $1,705 | $0 | $0 | $0 |
| 2019 | $1,583 | $0 | $0 | $0 |
| 2018 | $1,506 | $0 | $0 | $0 |
| 2017 | $1,506 | $0 | $0 | $0 |
| 2016 | $1,506 | $0 | $0 | $0 |
| 2015 | $1,442 | $0 | $0 | $0 |
| 2014 | -- | $107,600 | $23,859 | $83,741 |
| 2012 | -- | $15,328 | $1,803 | $13,525 |
Source: Public Records
Map
Nearby Homes