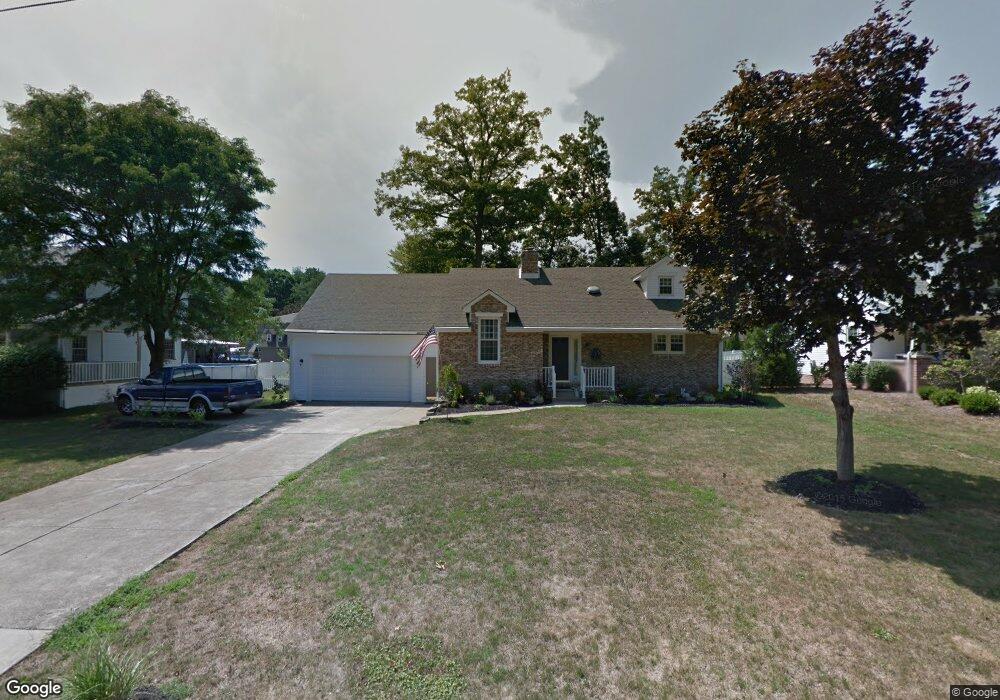
432 5th Ave Hubbard, OH 44425
Estimated Value: $266,000 - $387,000
2
Beds
2
Baths
1,096
Sq Ft
$276/Sq Ft
Est. Value
About This Home
This home is located at 432 5th Ave, Hubbard, OH 44425 and is currently estimated at $302,937, approximately $276 per square foot. 432 5th Ave is a home located in Trumbull County with nearby schools including Hubbard Elementary School, Hubbard Middle School, and Hubbard High School.
Ownership History
Date
Name
Owned For
Owner Type
Purchase Details
Closed on
May 31, 2016
Sold by
Juillerat Wilbur M and Juillerat Darlene
Bought by
Leigh Gregory R and Leigh Danielle E
Current Estimated Value
Home Financials for this Owner
Home Financials are based on the most recent Mortgage that was taken out on this home.
Original Mortgage
$141,600
Outstanding Balance
$112,845
Interest Rate
3.61%
Mortgage Type
New Conventional
Estimated Equity
$190,092
Purchase Details
Closed on
Apr 30, 2010
Sold by
Wilson Robert E and Wilson Diane L
Bought by
Juillerat Wilbur M and Juillerat Darlene
Purchase Details
Closed on
Mar 1, 2006
Sold by
Tremb John and Tremb Naomi
Bought by
Wilson Robert E and Wilson Diane L
Purchase Details
Closed on
Dec 23, 2005
Sold by
Tremb John and Tremb Naomi
Bought by
Wilson Robert E and Wilson Diane L
Purchase Details
Closed on
Jan 1, 1990
Bought by
Melanie B Lapaze
Create a Home Valuation Report for This Property
The Home Valuation Report is an in-depth analysis detailing your home's value as well as a comparison with similar homes in the area
Home Values in the Area
Average Home Value in this Area
Purchase History
| Date | Buyer | Sale Price | Title Company |
|---|---|---|---|
| Leigh Gregory R | $177,000 | None Available | |
| Juillerat Wilbur M | $130,000 | Attorney | |
| Wilson Robert E | $162,000 | None Available | |
| Wilson Robert E | $162,000 | None Available | |
| Melanie B Lapaze | -- | -- |
Source: Public Records
Mortgage History
| Date | Status | Borrower | Loan Amount |
|---|---|---|---|
| Open | Leigh Gregory R | $141,600 |
Source: Public Records
Tax History Compared to Growth
Tax History
| Year | Tax Paid | Tax Assessment Tax Assessment Total Assessment is a certain percentage of the fair market value that is determined by local assessors to be the total taxable value of land and additions on the property. | Land | Improvement |
|---|---|---|---|---|
| 2024 | $3,897 | $77,950 | $13,410 | $64,540 |
| 2023 | $3,897 | $77,950 | $13,410 | $64,540 |
| 2022 | $3,141 | $58,600 | $11,170 | $47,430 |
| 2021 | $3,156 | $58,600 | $11,170 | $47,430 |
| 2020 | $3,170 | $58,600 | $11,170 | $47,430 |
| 2019 | $3,000 | $53,140 | $11,170 | $41,970 |
| 2018 | $2,989 | $53,140 | $11,170 | $41,970 |
| 2017 | $2,981 | $53,140 | $11,170 | $41,970 |
| 2016 | $2,327 | $44,110 | $11,170 | $32,940 |
| 2015 | $2,337 | $44,110 | $11,170 | $32,940 |
| 2014 | $2,283 | $44,110 | $11,170 | $32,940 |
| 2013 | $2,279 | $44,110 | $11,170 | $32,940 |
Source: Public Records
Map
Nearby Homes
- 160 Hager St
- 203 Hager St
- 257 Westview Ave
- 366 Westview Ave
- 323 W Liberty St
- 124 Rebecca Ave
- 110 School St
- 50 Walnut St
- 3317 Beechwood Dr
- 312 W Park Ave
- 3275 Beechwood Dr
- 3234 Bell Wick Rd
- 430 E Park Ave
- V/L Jacobs Rd
- 138 Moore St
- 351 Elmwood Dr
- 2824 Benford Ln
- 2831 Benford Ln
- 2954 Megan Cir
- 2951 Megan Cir