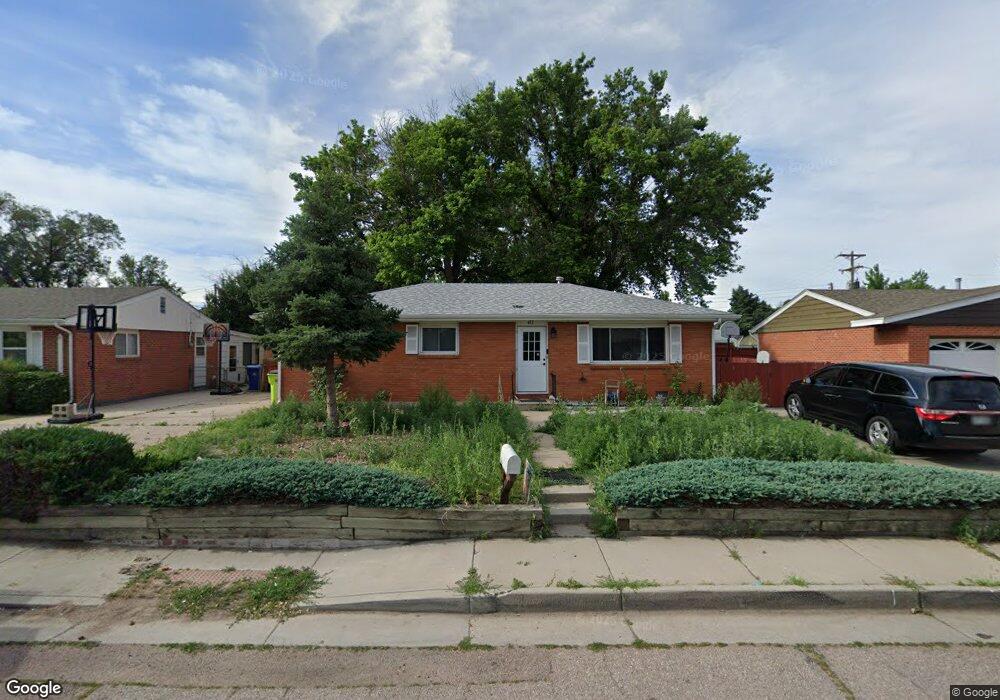
432 Columbine St Fountain, CO 80817
Downtown Fountain NeighborhoodEstimated Value: $299,781 - $339,000
3
Beds
1
Bath
1,144
Sq Ft
$277/Sq Ft
Est. Value
About This Home
This home is located at 432 Columbine St, Fountain, CO 80817 and is currently estimated at $316,695, approximately $276 per square foot. 432 Columbine St is a home located in El Paso County with nearby schools including Aragon Elementary School, Fountain Middle School, and Fountain-Fort Carson High School.
Ownership History
Date
Name
Owned For
Owner Type
Purchase Details
Closed on
Jun 4, 2021
Sold by
Clark Elizabeth H and Scriven Cynthia A
Bought by
Royer Coltlin and Bentley Megan Bentley
Current Estimated Value
Home Financials for this Owner
Home Financials are based on the most recent Mortgage that was taken out on this home.
Original Mortgage
$284,747
Outstanding Balance
$258,923
Interest Rate
2.9%
Mortgage Type
FHA
Estimated Equity
$57,772
Purchase Details
Closed on
Oct 13, 2010
Sold by
Clark Elizabeth H
Bought by
Clark Elizabeth H and Scriven Cynthia A
Purchase Details
Closed on
Mar 28, 1997
Sold by
Roberts Evelyn J
Bought by
Owens Mario J and Owens Deanza M
Home Financials for this Owner
Home Financials are based on the most recent Mortgage that was taken out on this home.
Original Mortgage
$77,622
Interest Rate
7.65%
Mortgage Type
FHA
Create a Home Valuation Report for This Property
The Home Valuation Report is an in-depth analysis detailing your home's value as well as a comparison with similar homes in the area
Home Values in the Area
Average Home Value in this Area
Purchase History
| Date | Buyer | Sale Price | Title Company |
|---|---|---|---|
| Royer Coltlin | $290,000 | Heritage Title Company | |
| Clark Elizabeth H | -- | None Available | |
| Owens Mario J | $77,500 | North American Title |
Source: Public Records
Mortgage History
| Date | Status | Borrower | Loan Amount |
|---|---|---|---|
| Open | Royer Coltlin | $284,747 | |
| Closed | Bentley Megan Bentley | $11,389 | |
| Previous Owner | Clark Elizabeth H | $47,720 | |
| Previous Owner | Clark Ralph E | $35,500 | |
| Previous Owner | Owens Mario J | $77,622 |
Source: Public Records
Tax History Compared to Growth
Tax History
| Year | Tax Paid | Tax Assessment Tax Assessment Total Assessment is a certain percentage of the fair market value that is determined by local assessors to be the total taxable value of land and additions on the property. | Land | Improvement |
|---|---|---|---|---|
| 2025 | $1,061 | $21,000 | -- | -- |
| 2024 | $1,061 | $21,430 | $3,390 | $18,040 |
| 2022 | $781 | $13,390 | $2,700 | $10,690 |
| 2021 | $363 | $13,780 | $2,780 | $11,000 |
| 2020 | $255 | $9,490 | $2,430 | $7,060 |
| 2019 | $250 | $9,490 | $2,430 | $7,060 |
| 2018 | $227 | $8,290 | $2,160 | $6,130 |
| 2017 | $224 | $8,290 | $2,160 | $6,130 |
| 2016 | $227 | $8,400 | $2,150 | $6,250 |
| 2015 | $227 | $8,400 | $2,150 | $6,250 |
| 2014 | $226 | $8,400 | $2,150 | $6,250 |
Source: Public Records
Map
Nearby Homes
- 418 Linda Vista Dr
- 800 Kiowa St
- 420 Rosewood Dr
- 330 Columbine St
- 9735 Cronin St
- 326 Columbine St
- 323 Mount View Ln
- 521 Clearview Dr
- 307 Mount View Ln
- 1005 Grinde Dr
- 157 Wellington St
- 1107 Grinde Dr
- 103 Mojave Way
- 929 Desert Cir
- 6856 Fountain Vista Cir
- 842 Desert Cir
- 845 Desert Cir
- 119 E Ohio Ave Unit 11 & 12
- 900 Pond Terrace
- 575 Blossom Field Rd
- 428 Columbine St
- 436 Columbine St
- 433 Linda Vista Dr
- 424 Columbine St
- 437 Linda Vista Dr
- 429 Linda Vista Dr
- 433 Columbine St
- 425 Linda Vista Dr
- 434 Linda Vista Dr
- 420 Columbine St
- 805 Kiowa St
- 421 Linda Vista Dr
- 425 Columbine St
- 425 Columbine St Unit 15
- 617 Kiowa St
- 416 Columbine St
- 430 Linda Vista Dr
- 620 Kiowa St
- 809 Kiowa St
- 417 Linda Vista Dr