Estimated Value: $355,000 - $381,000
3
Beds
1
Bath
1,278
Sq Ft
$286/Sq Ft
Est. Value
About This Home
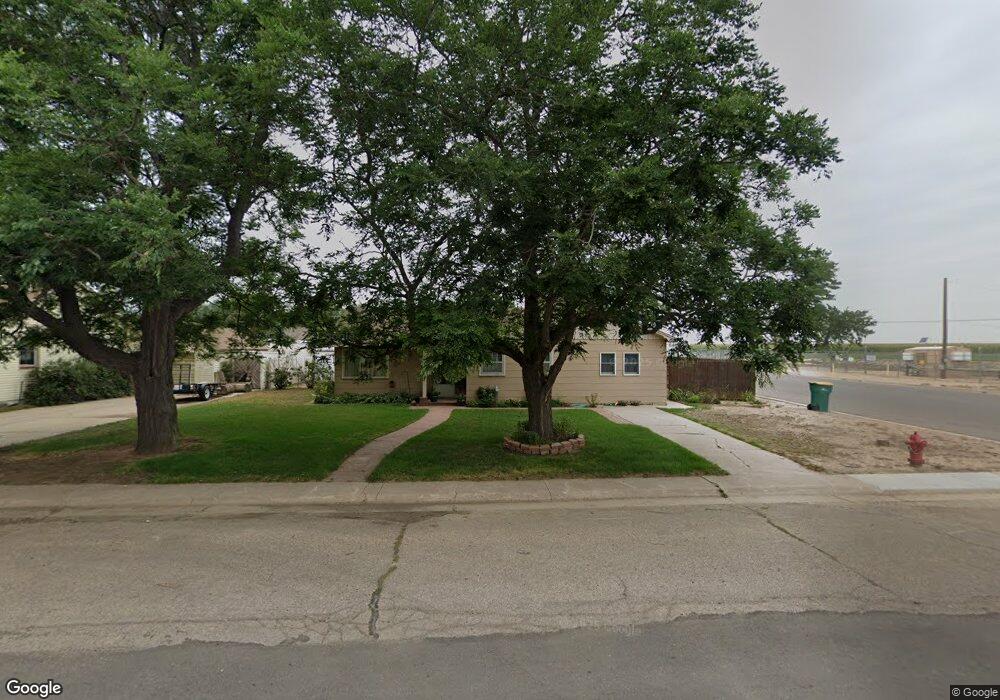
This home is located at 432 Cottonwood Ave, Eaton, CO 80615 and is currently estimated at $365,492, approximately $285 per square foot. 432 Cottonwood Ave is a home located in Weld County with nearby schools including Eaton High School and Northern Colorado Christian Academy.
Ownership History
Date
Name
Owned For
Owner Type
Purchase Details
Closed on
May 24, 2002
Sold by
Rohn Steven A and Rohn Heather C
Bought by
Seidler Ronald and Seidler Denise
Current Estimated Value
Home Financials for this Owner
Home Financials are based on the most recent Mortgage that was taken out on this home.
Original Mortgage
$138,040
Outstanding Balance
$58,248
Interest Rate
6.92%
Mortgage Type
FHA
Estimated Equity
$307,244
Purchase Details
Closed on
Mar 27, 1997
Sold by
Harring Bill A and Harring Sharin A
Bought by
Rohn Steven A and Rohn Heather C
Home Financials for this Owner
Home Financials are based on the most recent Mortgage that was taken out on this home.
Original Mortgage
$98,300
Interest Rate
7.65%
Mortgage Type
FHA
Purchase Details
Closed on
Jul 17, 1996
Sold by
Walker Bruce D
Bought by
Harring Bill A and Harring Sharin A
Purchase Details
Closed on
Nov 16, 1982
Purchase Details
Closed on
Sep 3, 1974
Purchase Details
Closed on
Aug 18, 1969
Create a Home Valuation Report for This Property
The Home Valuation Report is an in-depth analysis detailing your home's value as well as a comparison with similar homes in the area
Home Values in the Area
Average Home Value in this Area
Purchase History
| Date | Buyer | Sale Price | Title Company |
|---|---|---|---|
| Seidler Ronald | $140,000 | -- | |
| Rohn Steven A | $99,000 | -- | |
| Harring Bill A | -- | -- | |
| -- | -- | -- | |
| -- | -- | -- | |
| -- | -- | -- |
Source: Public Records
Mortgage History
| Date | Status | Borrower | Loan Amount |
|---|---|---|---|
| Open | Seidler Ronald | $138,040 | |
| Previous Owner | Rohn Steven A | $98,300 |
Source: Public Records
Tax History Compared to Growth
Tax History
| Year | Tax Paid | Tax Assessment Tax Assessment Total Assessment is a certain percentage of the fair market value that is determined by local assessors to be the total taxable value of land and additions on the property. | Land | Improvement |
|---|---|---|---|---|
| 2025 | $1,690 | $20,450 | $3,310 | $17,140 |
| 2024 | $1,690 | $20,450 | $3,310 | $17,140 |
| 2023 | $1,507 | $24,200 | $5,640 | $18,560 |
| 2022 | $1,487 | $18,510 | $4,430 | $14,080 |
| 2021 | $1,722 | $19,040 | $4,550 | $14,490 |
| 2020 | $1,471 | $18,240 | $3,220 | $15,020 |
| 2019 | $1,548 | $18,240 | $3,220 | $15,020 |
| 2018 | $977 | $13,470 | $2,610 | $10,860 |
| 2017 | $1,008 | $13,470 | $2,610 | $10,860 |
| 2016 | $907 | $12,260 | $2,630 | $9,630 |
| 2015 | $846 | $12,260 | $2,630 | $9,630 |
| 2014 | $620 | $9,220 | $2,630 | $6,590 |
Source: Public Records
Map
Nearby Homes
- 435 Birch Ave
- 410 Cottonwood Ave
- 425 Spruce Ave
- 516 Elm Ave
- 1250 5th St
- 1240 3rd St
- 121 Elm Ave
- 1330 3rd St
- 1135 Huckleberry Ln Unit 2
- 105 Walnut Ave
- 29 Pioneer Place
- 1344 Sage Dr
- 356 Sycamore Ave
- 1155 Black Hawk Rd
- 1344 Cimarron Cir
- 910 E 3rd St
- 735 S Mountain View Dr
- 1220 Swainson Rd
- 1230 Swainson Rd
- 360 Peregrine Point
- 426 Cottonwood Ave
- 420 Cottonwood Ave
- 780 5th St
- 455 Birch Ave
- 445 Birch Ave
- 433 Cottonwood Ave
- 414 Cottonwood Ave
- 427 Cottonwood Ave
- 419 Cottonwood Ave
- 515 5th St
- 413 Cottonwood Ave
- 480 Birch Ave
- 411 Cottonwood Ave
- 425 Birch Ave
- 470 Birch Ave
- 409 Cottonwood Ave
- 404 Cottonwood Ave
- 460 Birch Ave
- 434 Park Ave
- 430 Park Ave