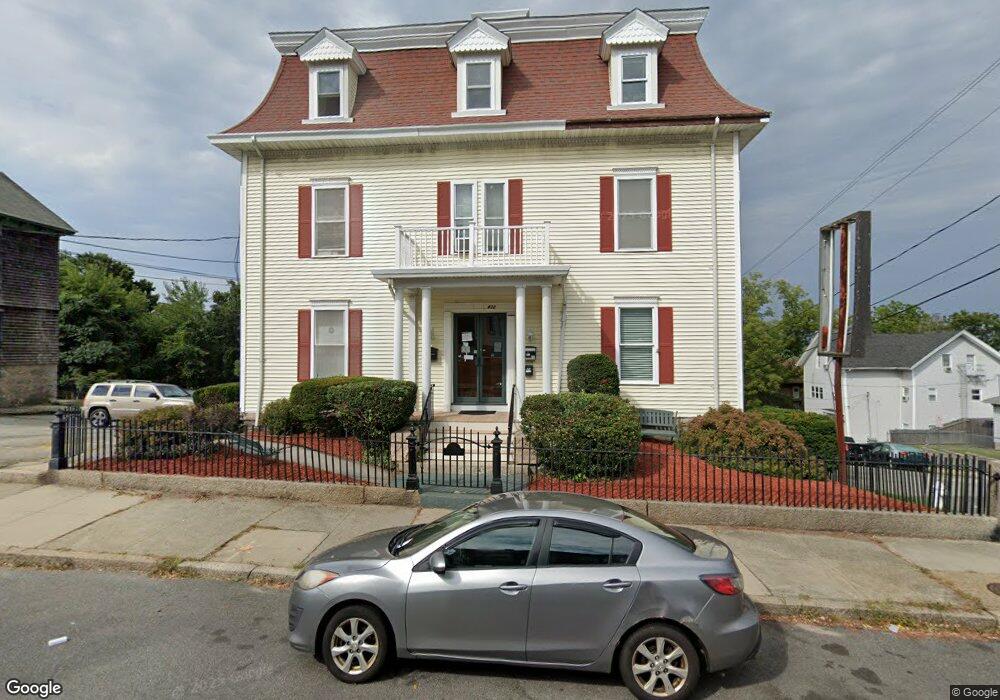
432 Durfee St Fall River, MA 02720
Lower Highlands NeighborhoodEstimated Value: $826,000
6
Beds
4
Baths
6,047
Sq Ft
$137/Sq Ft
Est. Value
About This Home
This home is located at 432 Durfee St, Fall River, MA 02720 and is currently priced at $826,000, approximately $136 per square foot. 432 Durfee St is a home located in Bristol County with nearby schools including Mary Fonseca Elementary School, Morton Middle School, and B M C Durfee High School.
Ownership History
Date
Name
Owned For
Owner Type
Purchase Details
Closed on
Apr 18, 2025
Sold by
C B Rt and Monte
Bought by
Cabs Waterfront View Llc
Current Estimated Value
Home Financials for this Owner
Home Financials are based on the most recent Mortgage that was taken out on this home.
Original Mortgage
$305,000
Outstanding Balance
$303,087
Interest Rate
6.63%
Mortgage Type
Purchase Money Mortgage
Purchase Details
Closed on
Sep 6, 2011
Sold by
Bonhomme Marie C and Rockland Trust Co
Bought by
Furnace Village Realty
Purchase Details
Closed on
Jul 6, 2006
Sold by
Burton Carolyn A
Bought by
Cb Rt and Burton
Purchase Details
Closed on
Apr 13, 2006
Sold by
432 Durfee St Rt and Lebreux
Bought by
Burton Carolyn A
Purchase Details
Closed on
Mar 6, 1995
Sold by
Fall River Rlty Inc
Bought by
Durfee Street Rt
Home Financials for this Owner
Home Financials are based on the most recent Mortgage that was taken out on this home.
Original Mortgage
$70,000
Interest Rate
8.96%
Mortgage Type
Commercial
Create a Home Valuation Report for This Property
The Home Valuation Report is an in-depth analysis detailing your home's value as well as a comparison with similar homes in the area
Home Values in the Area
Average Home Value in this Area
Purchase History
| Date | Buyer | Sale Price | Title Company |
|---|---|---|---|
| Cabs Waterfront View Llc | $305,000 | None Available | |
| Cabs Waterfront View Llc | $305,000 | None Available | |
| Furnace Village Realty | $108,000 | -- | |
| Furnace Village Realty | $108,000 | -- | |
| Cb Rt | -- | -- | |
| Cb Rt | -- | -- | |
| Burton Carolyn A | -- | -- | |
| Burton Carolyn A | -- | -- | |
| Durfee Street Rt | $23,600 | -- | |
| Durfee Street Rt | $23,600 | -- |
Source: Public Records
Mortgage History
| Date | Status | Borrower | Loan Amount |
|---|---|---|---|
| Open | Cabs Waterfront View Llc | $305,000 | |
| Closed | Cabs Waterfront View Llc | $305,000 | |
| Previous Owner | Durfee Street Rt | $157,500 | |
| Previous Owner | Durfee Street Rt | $70,000 |
Source: Public Records
Tax History
| Year | Tax Paid | Tax Assessment Tax Assessment Total Assessment is a certain percentage of the fair market value that is determined by local assessors to be the total taxable value of land and additions on the property. | Land | Improvement |
|---|---|---|---|---|
| 2025 | $6,515 | $588,200 | $130,500 | $457,700 |
| 2024 | $6,515 | $567,000 | $125,500 | $441,500 |
| 2023 | $0 | $420,200 | $107,600 | $312,600 |
| 2022 | $0 | $410,400 | $97,800 | $312,600 |
| 2021 | $0 | $407,400 | $90,500 | $316,900 |
| 2020 | $0 | $377,000 | $86,600 | $290,400 |
| 2019 | $0 | $385,400 | $82,500 | $302,900 |
| 2018 | $0 | $374,100 | $81,000 | $293,100 |
| 2017 | $0 | $375,700 | $82,600 | $293,100 |
| 2016 | -- | $379,100 | $86,000 | $293,100 |
| 2015 | -- | $376,300 | $82,800 | $293,500 |
| 2014 | -- | $380,700 | $87,200 | $293,500 |
Source: Public Records
Map
Nearby Homes
- 337 Danforth St Unit 7
- 339 Danforth St Unit 6
- 9 Doctor St
- 575 N Main St
- 126 June St
- 450 Rock St Unit 1
- 206 Durfee St Unit 1A
- 206 Durfee St Unit 2B
- 206 Durfee St Unit 2A
- 206 Durfee St Unit 1B
- 34 Danforth St
- 360 High St
- 499 Maple St
- 150 Purchase St
- 72 Belmont St
- 750 Davol St Unit 1012
- 750 Davol St Unit 219
- 750 Davol St Unit 221
- 750 Davol St Unit 616
- 750 Davol St Unit 214
- 115 Maple St
- 410 Durfee St
- 410 Durfee St Unit 1
- 452 Durfee St Unit 1
- 452 Durfee St Unit A
- 452 Durfee St
- 159 Maple St
- 406 Durfee St
- 118 Maple St
- 118 Maple St Unit 2
- 118 Maple St Unit 3
- 118 Maple St Unit 1
- 396 Durfee St
- 396 Durfee St Unit 1
- 154 Maple St
- 255 Danforth St Unit C
- 255 Danforth St
- 255 Danforth St Unit 3-L
- 255 Danforth St Unit 3K
- 255 Danforth St Unit I
Your Personal Tour Guide
Ask me questions while you tour the home.