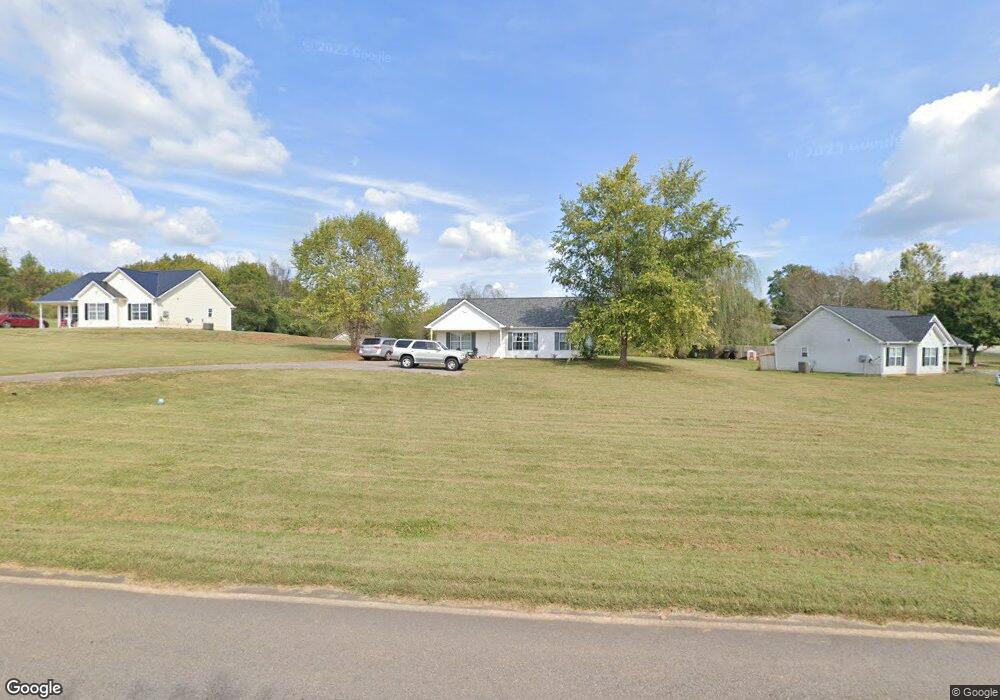
432 Fortner Dr Dahlonega, GA 30533
Estimated Value: $257,720 - $299,000
3
Beds
2
Baths
1,130
Sq Ft
$247/Sq Ft
Est. Value
About This Home
This home is located at 432 Fortner Dr, Dahlonega, GA 30533 and is currently estimated at $278,680, approximately $246 per square foot. 432 Fortner Dr is a home located in Lumpkin County with nearby schools including Clay County Middle School and Lumpkin County High School.
Ownership History
Date
Name
Owned For
Owner Type
Purchase Details
Closed on
Aug 4, 2021
Sold by
Naylor Jeffrey Wayne
Bought by
Naylor Judy Ann
Current Estimated Value
Purchase Details
Closed on
Dec 8, 2016
Sold by
Clayton W
Bought by
Naylor Jeffrey W
Purchase Details
Closed on
May 13, 2010
Sold by
Waters Kim
Bought by
Naylor Clayton W
Home Financials for this Owner
Home Financials are based on the most recent Mortgage that was taken out on this home.
Original Mortgage
$98,679
Interest Rate
5.5%
Mortgage Type
FHA
Purchase Details
Closed on
Feb 28, 2005
Sold by
Southern Developing Inc
Bought by
Waters Kim
Home Financials for this Owner
Home Financials are based on the most recent Mortgage that was taken out on this home.
Original Mortgage
$90,000
Interest Rate
5.6%
Mortgage Type
New Conventional
Purchase Details
Closed on
Mar 24, 2004
Sold by
Gaddis Jennifer
Bought by
Southern Developing Inc
Purchase Details
Closed on
Mar 17, 2004
Sold by
Anderson Armstong
Bought by
Gaddis Jennifer
Create a Home Valuation Report for This Property
The Home Valuation Report is an in-depth analysis detailing your home's value as well as a comparison with similar homes in the area
Home Values in the Area
Average Home Value in this Area
Purchase History
| Date | Buyer | Sale Price | Title Company |
|---|---|---|---|
| Naylor Judy Ann | -- | -- | |
| Naylor Jeffrey W | -- | -- | |
| Naylor Clayton W | $100,500 | -- | |
| Waters Kim | $100,000 | -- | |
| Southern Developing Inc | $156,000 | -- | |
| Gaddis Jennifer | $146,000 | -- |
Source: Public Records
Mortgage History
| Date | Status | Borrower | Loan Amount |
|---|---|---|---|
| Previous Owner | Naylor Clayton W | $98,679 | |
| Previous Owner | Waters Kim | $90,000 |
Source: Public Records
Tax History Compared to Growth
Tax History
| Year | Tax Paid | Tax Assessment Tax Assessment Total Assessment is a certain percentage of the fair market value that is determined by local assessors to be the total taxable value of land and additions on the property. | Land | Improvement |
|---|---|---|---|---|
| 2024 | $1,780 | $74,774 | $10,000 | $64,774 |
| 2023 | $1,644 | $69,882 | $10,000 | $59,882 |
| 2022 | $1,467 | $59,249 | $10,000 | $49,249 |
| 2021 | $1,271 | $49,657 | $10,000 | $39,657 |
| 2020 | $1,275 | $48,344 | $10,000 | $38,344 |
| 2019 | $1,287 | $48,344 | $10,000 | $38,344 |
| 2018 | $1,238 | $43,622 | $10,000 | $33,622 |
| 2017 | $1,063 | $36,736 | $6,000 | $30,736 |
| 2016 | $1,000 | $33,450 | $6,000 | $27,450 |
| 2015 | $890 | $33,450 | $6,000 | $27,450 |
| 2014 | $890 | $33,755 | $6,000 | $27,755 |
| 2013 | -- | $34,059 | $6,000 | $28,059 |
Source: Public Records
Map
Nearby Homes
- 1323 Cavender Creek Rd
- 165 Porter Springs Rd
- 0 Porter Springs Rd Unit 7685063
- 0 Porter Springs Rd Unit 10648400
- 00 LOT C Cavender Creek Rd
- 372 Porter Springs Rd
- 03 Kate Rd
- 34 Great Works Dr
- 85 Summit Canyon Rd Unit H102
- 00 Cavender Creek Rd
- 496 Beaver Dam Rd
- 2589 Morrison Moore Pkwy E
- 302 Pointe Cir
- 1437 Porter Springs Rd
- 4039 Highway 19 N
- 238 Grand View St
- 7.123 Acres Halls Mill Rd
- 65 Golden Autumn Dr
- 1036 Wards Creek Dr
- 458 Fortner Dr
- 358 Fortner Dr
- 326 Fortner Dr
- 0 Fortner Dr Unit 7167973
- 0 Fortner Dr Unit 8309733
- 0 Fortner Dr Unit 7606922
- 468 Fortner Dr
- 462 Fortner Dr
- 211 Wimpy Farm Rd
- 504 Fortner Dr
- 30 Farm View Ln
- 316 Fortner Dr
- 508 Fortner Dr
- 296 Fortner Dr
- 45 Farm View Ln
- 257 Fortner Dr
- 80 Farm View Ln
- 1396 Cavender Creek Rd
- 0 Farm View Ln
- 1326 Cavender Creek Rd