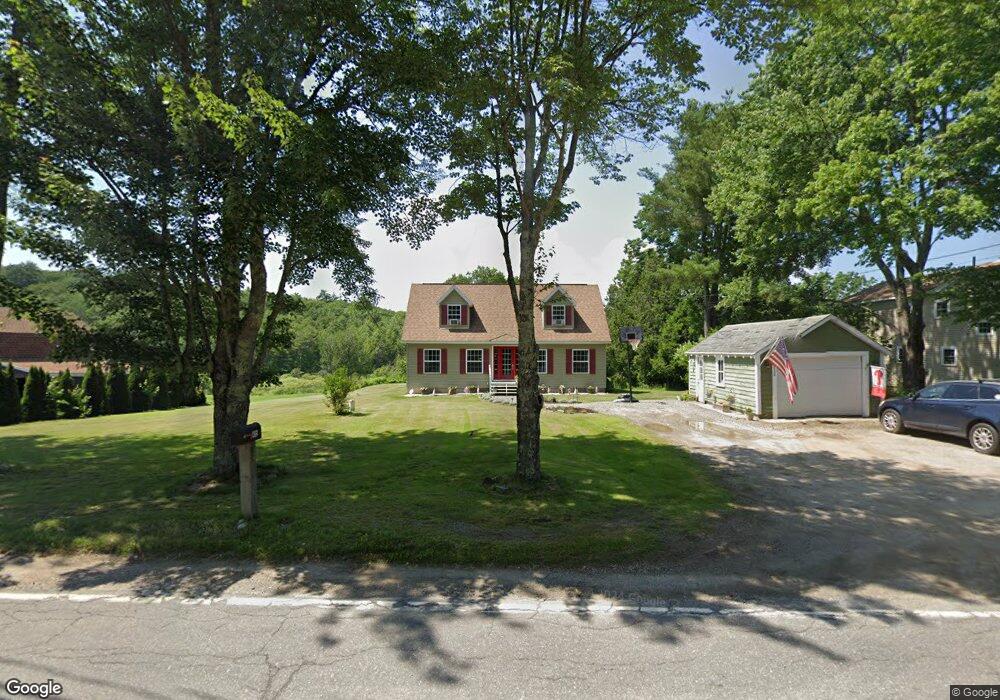
432 Middle Rd Woolwich, ME 04579
Estimated Value: $449,629 - $589,000
3
Beds
2
Baths
1,425
Sq Ft
$385/Sq Ft
Est. Value
About This Home
This home is located at 432 Middle Rd, Woolwich, ME 04579 and is currently estimated at $548,157, approximately $384 per square foot. 432 Middle Rd is a home located in Sagadahoc County with nearby schools including Morse High School and Hyde School.
Ownership History
Date
Name
Owned For
Owner Type
Purchase Details
Closed on
May 28, 2021
Sold by
Bovey Benjamin N
Bought by
Raymond Jordan R and Raymond Scott M
Current Estimated Value
Home Financials for this Owner
Home Financials are based on the most recent Mortgage that was taken out on this home.
Original Mortgage
$322,400
Outstanding Balance
$289,189
Interest Rate
3%
Mortgage Type
Purchase Money Mortgage
Estimated Equity
$258,968
Purchase Details
Closed on
Dec 4, 2018
Sold by
Mitchell James M and Mitchell Angeline R
Bought by
Bovey Benjamin N
Home Financials for this Owner
Home Financials are based on the most recent Mortgage that was taken out on this home.
Original Mortgage
$298,364
Interest Rate
4.8%
Mortgage Type
VA
Create a Home Valuation Report for This Property
The Home Valuation Report is an in-depth analysis detailing your home's value as well as a comparison with similar homes in the area
Home Values in the Area
Average Home Value in this Area
Purchase History
| Date | Buyer | Sale Price | Title Company |
|---|---|---|---|
| Raymond Jordan R | -- | None Available | |
| Bovey Benjamin N | -- | -- |
Source: Public Records
Mortgage History
| Date | Status | Borrower | Loan Amount |
|---|---|---|---|
| Open | Raymond Jordan R | $322,400 | |
| Previous Owner | Bovey Benjamin N | $298,364 |
Source: Public Records
Tax History
| Year | Tax Paid | Tax Assessment Tax Assessment Total Assessment is a certain percentage of the fair market value that is determined by local assessors to be the total taxable value of land and additions on the property. | Land | Improvement |
|---|---|---|---|---|
| 2025 | $4,715 | $462,300 | $94,600 | $367,700 |
| 2024 | $3,408 | $204,100 | $34,300 | $169,800 |
| 2023 | $3,143 | $204,100 | $34,300 | $169,800 |
| 2022 | $3,143 | $204,100 | $34,300 | $169,800 |
| 2021 | $3,143 | $204,100 | $34,300 | $169,800 |
| 2020 | $3,143 | $204,100 | $34,300 | $169,800 |
| 2019 | $3,092 | $204,100 | $34,300 | $169,800 |
| 2018 | $1,558 | $191,200 | $34,300 | $156,900 |
| 2017 | $1,508 | $191,200 | $34,300 | $156,900 |
| 2016 | $2,715 | $191,200 | $34,300 | $156,900 |
| 2015 | $2,715 | $191,200 | $34,300 | $156,900 |
| 2014 | $2,734 | $191,200 | $34,300 | $156,900 |
| 2013 | $2,639 | $191,200 | $34,300 | $156,900 |
Source: Public Records
Map
Nearby Homes
Your Personal Tour Guide
Ask me questions while you tour the home.