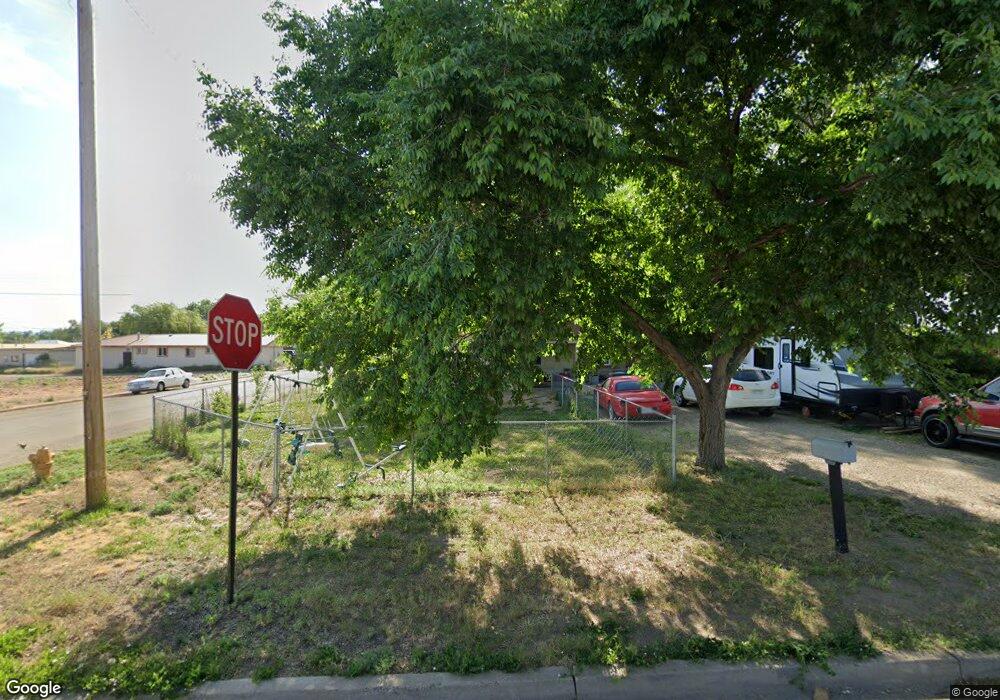
432 N Linden St Cortez, CO 81321
Estimated Value: $227,848 - $251,000
3
Beds
1
Bath
985
Sq Ft
$245/Sq Ft
Est. Value
About This Home
This home is located at 432 N Linden St, Cortez, CO 81321 and is currently estimated at $240,962, approximately $244 per square foot. 432 N Linden St is a home located in Montezuma County with nearby schools including Montezuma-Cortez High School, Children's Kiva Montessori School, and Children's Kiva Montessori Preschool & Kindergarten.
Ownership History
Date
Name
Owned For
Owner Type
Purchase Details
Closed on
Apr 26, 2013
Sold by
Weishel Dale Greenwood
Bought by
Marlman David A
Current Estimated Value
Home Financials for this Owner
Home Financials are based on the most recent Mortgage that was taken out on this home.
Original Mortgage
$53,010
Outstanding Balance
$37,882
Interest Rate
3.67%
Mortgage Type
New Conventional
Estimated Equity
$203,080
Purchase Details
Closed on
Oct 6, 1993
Sold by
Halls Suzette Gary F
Bought by
Weishel Jay E and Weishel Dale
Purchase Details
Closed on
Dec 13, 1991
Sold by
Whiteley Cheryl and Whiteley Marie
Bought by
Halls Suzette Gary F
Purchase Details
Closed on
Oct 30, 1990
Sold by
Heer Frank L and Heer M. Danet
Bought by
Whiteley Cheryl and Whiteley Marie
Purchase Details
Closed on
Jul 12, 1990
Sold by
Lindner Laurence C. Esta
Bought by
Heer Frank L and Heer M. Danette
Create a Home Valuation Report for This Property
The Home Valuation Report is an in-depth analysis detailing your home's value as well as a comparison with similar homes in the area
Home Values in the Area
Average Home Value in this Area
Purchase History
| Date | Buyer | Sale Price | Title Company |
|---|---|---|---|
| Marlman David A | -- | Colorado Land Title Co | |
| Weishel Jay E | $32,000 | -- | |
| Halls Suzette Gary F | $27,000 | -- | |
| Whiteley Cheryl | $26,000 | -- | |
| Heer Frank L | $17,500 | -- |
Source: Public Records
Mortgage History
| Date | Status | Borrower | Loan Amount |
|---|---|---|---|
| Open | Marlman David A | $53,010 |
Source: Public Records
Tax History Compared to Growth
Tax History
| Year | Tax Paid | Tax Assessment Tax Assessment Total Assessment is a certain percentage of the fair market value that is determined by local assessors to be the total taxable value of land and additions on the property. | Land | Improvement |
|---|---|---|---|---|
| 2024 | $476 | $9,266 | $1,011 | $8,255 |
| 2023 | $476 | $13,644 | $1,489 | $12,155 |
| 2022 | $472 | $9,760 | $1,489 | $8,271 |
| 2021 | $480 | $9,760 | $1,489 | $8,271 |
| 2020 | $453 | $9,559 | $1,489 | $8,070 |
| 2019 | $454 | $9,559 | $1,489 | $8,070 |
| 2018 | $433 | $6,800 | $1,350 | $5,450 |
| 2017 | $431 | $6,800 | $1,350 | $5,450 |
| 2016 | $389 | $6,770 | $1,490 | $5,280 |
| 2015 | $357 | $98,570 | $0 | $0 |
| 2014 | $416 | $6,770 | $0 | $0 |
Source: Public Records
Map
Nearby Homes
- 210 W Coronado Ave
- 537 N Elm St
- 409 N Broadway
- 240 N Elm St
- 235 N Chestnut St Unit 6
- 521 N Beech St
- 23 E Montezuma Ave
- 102 E Montezuma Ave
- 416 N Ash St
- Tract 9 N Broadway
- 323 N Washington St
- 115 S Linden St
- 243 N Madison St
- 122 E 1st St Unit see broker remarks
- TBD Lebanon Rd
- TRACT 12 N Broadway
- 625 N Harrison St
- Tract 10 Road K 3
- TRACT 13 Road K 3
- 506 Amanda Lee Ln
- 430 N Linden St
- 217 W Coronado Ave
- 424 N Linden St
- 510 N Broadway
- 510 & 510 5 N Broadway
- 205 W Coronado Ave
- 510 & 510. N Broadway
- 432 N Broadway
- 211 W Coronado Ave
- 406 N Linden St
- 431 N Elm St
- 485 N Broadway
- 402 N Linden St
- 210 W Downey Ave
- 208 W Downey Ave
- 521 N Elm St
- 413 N Linden St
- 512 N Broadway
- 0 Downey Unit 731597
- 403 N Linden St