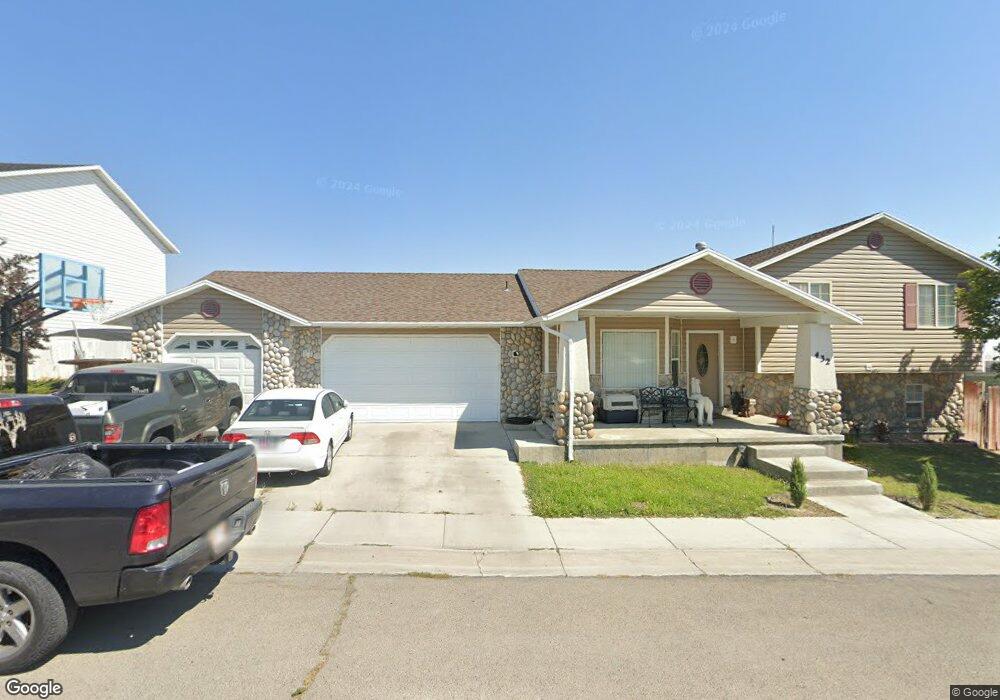
432 N Vista View Loop West Wendover, NV 89883
Estimated Value: $353,000 - $396,000
--
Bed
--
Bath
1,848
Sq Ft
$200/Sq Ft
Est. Value
About This Home
This home is located at 432 N Vista View Loop, West Wendover, NV 89883 and is currently estimated at $369,086, approximately $199 per square foot. 432 N Vista View Loop is a home with nearby schools including West Wendover Elementary School, West Wendover Junior High School, and West Wendover High School.
Ownership History
Date
Name
Owned For
Owner Type
Purchase Details
Closed on
Jun 27, 2012
Sold by
Blake Bryant W
Bought by
Romero Gabriel and Gomez Maria D
Current Estimated Value
Home Financials for this Owner
Home Financials are based on the most recent Mortgage that was taken out on this home.
Original Mortgage
$194,897
Outstanding Balance
$134,407
Interest Rate
3.65%
Mortgage Type
New Conventional
Estimated Equity
$234,679
Purchase Details
Closed on
May 24, 2011
Sold by
Blake Michelle B
Bought by
Blake Bryant W
Home Financials for this Owner
Home Financials are based on the most recent Mortgage that was taken out on this home.
Original Mortgage
$192,518
Interest Rate
4.71%
Mortgage Type
FHA
Purchase Details
Closed on
Jul 25, 2005
Sold by
Frank Walter H and Frank Dianna M
Bought by
Blake Bryant W and Blake Michelle B
Create a Home Valuation Report for This Property
The Home Valuation Report is an in-depth analysis detailing your home's value as well as a comparison with similar homes in the area
Home Values in the Area
Average Home Value in this Area
Purchase History
| Date | Buyer | Sale Price | Title Company |
|---|---|---|---|
| Romero Gabriel | $191,000 | First American Title Elko | |
| Blake Bryant W | -- | First American Title Elko | |
| Blake Bryant W | $208,500 | First American Title |
Source: Public Records
Mortgage History
| Date | Status | Borrower | Loan Amount |
|---|---|---|---|
| Open | Romero Gabriel | $194,897 | |
| Previous Owner | Blake Bryant W | $192,518 |
Source: Public Records
Tax History Compared to Growth
Tax History
| Year | Tax Paid | Tax Assessment Tax Assessment Total Assessment is a certain percentage of the fair market value that is determined by local assessors to be the total taxable value of land and additions on the property. | Land | Improvement |
|---|---|---|---|---|
| 2025 | $3,581 | $95,162 | $10,080 | $85,082 |
| 2024 | $3,581 | $96,588 | $10,080 | $86,508 |
| 2023 | $3,176 | $91,276 | $10,080 | $81,196 |
| 2022 | $2,943 | $79,040 | $10,080 | $68,960 |
| 2021 | $2,919 | $77,321 | $10,080 | $67,241 |
| 2020 | $2,924 | $78,193 | $10,080 | $68,113 |
| 2019 | $2,826 | $74,766 | $10,080 | $64,686 |
| 2018 | $2,835 | $75,010 | $10,080 | $64,930 |
| 2017 | $2,797 | $73,970 | $10,080 | $63,890 |
| 2016 | $2,825 | $74,043 | $10,080 | $63,963 |
| 2015 | $2,799 | $73,169 | $10,080 | $63,089 |
| 2014 | $2,610 | $70,195 | $10,080 | $60,115 |
Source: Public Records
Map
Nearby Homes
- 901 Alpine St
- 0 Pueblo Blvd Unit 11071957
- 0 Pueblo Blvd Unit 25262568
- 871 Blue Grass Cir
- 867 Blue Grass Cir
- 861 Blue Grass Cir
- 2000 Blue Grass Cir
- 863 Blue Grass Cir
- 2101 Blue Grass Cir
- 879 Blue Grass Cir
- 2103 Blue Grass Cir
- 0 Sec 17 Twp 33n Rge 70e Mdb&m Unit 3627164
- 875 Blue Grass Cir
- 2102 Blue Grass Cir
- 0 N Butte St
- 0 Butte St Unit 3627062
- 1890 Pueblo Blvd
- 2928 Fairway View Dr
- 3000 Fairway View Dr
- 3044 Fairway View Dr
- 426 N Vista View Loop
- 444 N Vista View Loop
- 451 N Vista View Loop
- 450 N Vista View Loop
- 414 W Vista View Loop
- 450 N Tibbets Blvd
- 457 N Vista View Loop
- 334 N Toana Ct
- 340 Toana Ct
- 456 N Tibbets Blvd
- 344 N Toana Ct
- 456 N Vista View Loop
- 462 N Tibbets Blvd
- 469 N Vista View Loop
- 462 N Vista View Loop
- 2329 Sandia Cir
- 468 N Tibbets Blvd
- 2319 Sandia Cir
- 383 N Tibbets Blvd
- 343 N Toana Ct