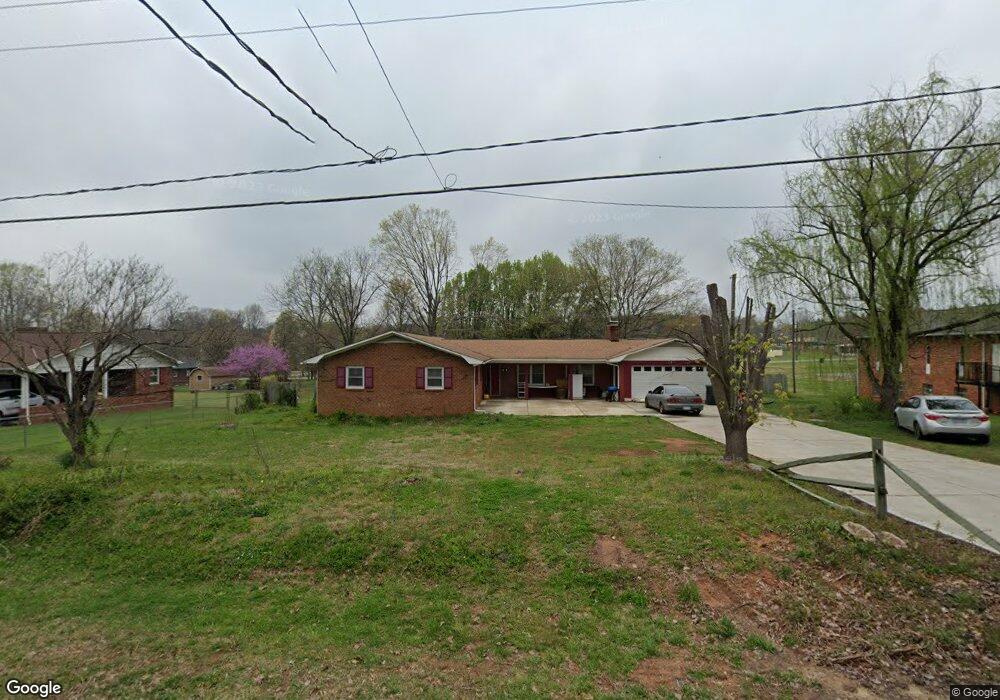
432 Nixon Rd Statesville, NC 28625
Estimated Value: $247,000 - $311,000
3
Beds
2
Baths
1,415
Sq Ft
$199/Sq Ft
Est. Value
About This Home
This home is located at 432 Nixon Rd, Statesville, NC 28625 and is currently estimated at $281,441, approximately $198 per square foot. 432 Nixon Rd is a home located in Iredell County with nearby schools including Cloverleaf Elementary School, Third Creek Middle School, and Statesville High School.
Ownership History
Date
Name
Owned For
Owner Type
Purchase Details
Closed on
Sep 20, 2024
Sold by
Baza Abel Serrano and Serrano Abel
Bought by
Serrano Abel and Serrano Maria Ines
Current Estimated Value
Purchase Details
Closed on
Oct 29, 2004
Sold by
Moore Marsha K
Bought by
Serrano Serrano Abel Abel and Serrano Baza Abel
Home Financials for this Owner
Home Financials are based on the most recent Mortgage that was taken out on this home.
Original Mortgage
$98,400
Interest Rate
5.64%
Mortgage Type
Purchase Money Mortgage
Purchase Details
Closed on
Jun 8, 2001
Sold by
Williams Charles A and Williams Becky P
Bought by
Moore Marsha K
Home Financials for this Owner
Home Financials are based on the most recent Mortgage that was taken out on this home.
Original Mortgage
$104,500
Interest Rate
7.05%
Purchase Details
Closed on
Sep 1, 1987
Purchase Details
Closed on
Aug 1, 1983
Purchase Details
Closed on
Jun 1, 1976
Create a Home Valuation Report for This Property
The Home Valuation Report is an in-depth analysis detailing your home's value as well as a comparison with similar homes in the area
Home Values in the Area
Average Home Value in this Area
Purchase History
| Date | Buyer | Sale Price | Title Company |
|---|---|---|---|
| Serrano Abel | -- | None Listed On Document | |
| Serrano Serrano Abel Abel | $123,000 | -- | |
| Moore Marsha K | $110,000 | -- | |
| -- | $58,000 | -- | |
| -- | $48,000 | -- | |
| -- | $38,500 | -- |
Source: Public Records
Mortgage History
| Date | Status | Borrower | Loan Amount |
|---|---|---|---|
| Previous Owner | Serrano Serrano Abel Abel | $98,400 | |
| Previous Owner | Moore Marsha K | $104,500 | |
| Closed | Serrano Serrano Abel Abel | $24,600 |
Source: Public Records
Tax History Compared to Growth
Tax History
| Year | Tax Paid | Tax Assessment Tax Assessment Total Assessment is a certain percentage of the fair market value that is determined by local assessors to be the total taxable value of land and additions on the property. | Land | Improvement |
|---|---|---|---|---|
| 2024 | $1,381 | $223,910 | $30,000 | $193,910 |
| 2023 | $1,031 | $223,910 | $30,000 | $193,910 |
| 2022 | $950 | $141,780 | $15,000 | $126,780 |
| 2021 | $946 | $141,780 | $15,000 | $126,780 |
| 2020 | $946 | $141,780 | $15,000 | $126,780 |
| 2019 | $931 | $141,780 | $15,000 | $126,780 |
| 2018 | $818 | $128,170 | $14,000 | $114,170 |
| 2017 | $818 | $128,170 | $14,000 | $114,170 |
| 2016 | $818 | $128,170 | $14,000 | $114,170 |
| 2015 | $801 | $125,290 | $14,000 | $111,290 |
| 2014 | $649 | $129,100 | $14,000 | $115,100 |
Source: Public Records
Map
Nearby Homes
- 104 Postell Dr
- 116 Postell Dr
- 152 Postell Dr
- 678 Turnersburg Hwy
- 2 Whites Farm Rd
- 166 Rock Ave
- 156 Rock Ave
- 103 Fairdale Rd
- 495&501 Turnersburg Hwy
- 130 Rock Ave
- 125 Rock Ave
- 131 Clearview Rd
- 136 Rimmer Rd
- Winslow Plan at Heritage Hall
- Riley Plan at Heritage Hall
- Hudson Plan at Heritage Hall
- Wayne Plan at Heritage Hall
- Kensington Plan at Heritage Hall
- Kipling Plan at Heritage Hall
- Calloway Plan at Heritage Hall