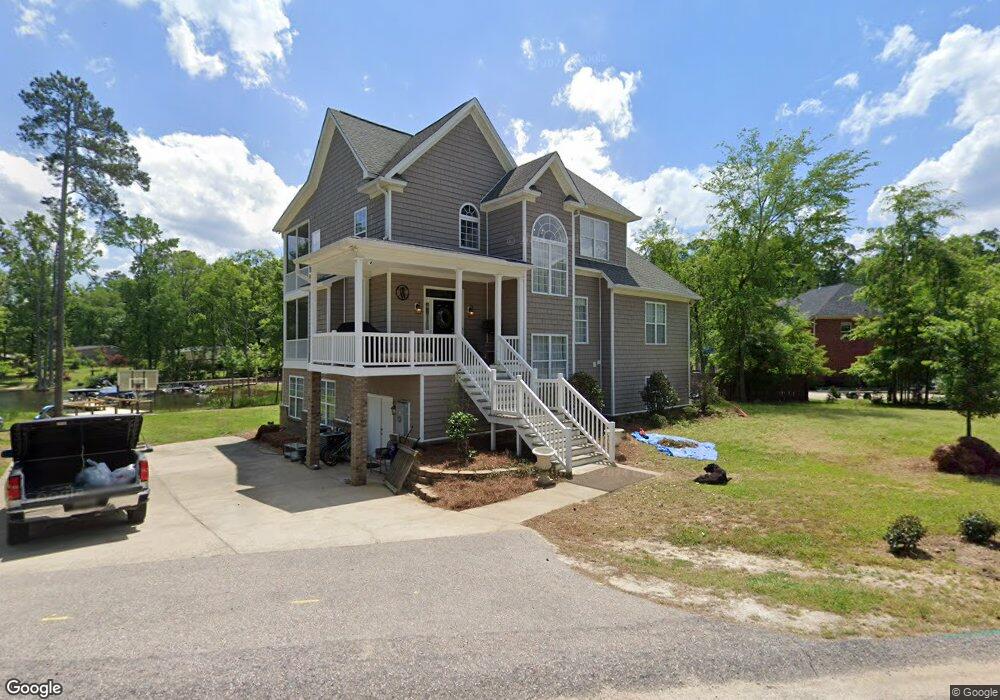
432 Quiet Pines Rd Chapin, SC 29036
Estimated Value: $545,000 - $848,597
4
Beds
3
Baths
2,488
Sq Ft
$280/Sq Ft
Est. Value
About This Home
This home is located at 432 Quiet Pines Rd, Chapin, SC 29036 and is currently estimated at $697,399, approximately $280 per square foot. 432 Quiet Pines Rd is a home located in Lexington County with nearby schools including Chapin Elementary School, Chapin Intermediate, and Chapin High School.
Ownership History
Date
Name
Owned For
Owner Type
Purchase Details
Closed on
Oct 28, 2013
Sold by
Federal National Mortgage Association
Bought by
Ward John C and Ward Stacie E
Current Estimated Value
Home Financials for this Owner
Home Financials are based on the most recent Mortgage that was taken out on this home.
Original Mortgage
$336,300
Outstanding Balance
$249,260
Interest Rate
4.23%
Mortgage Type
Future Advance Clause Open End Mortgage
Estimated Equity
$448,139
Purchase Details
Closed on
Apr 13, 2013
Sold by
Comose Timothy A and Comose Cynthia A
Bought by
Federal National Mortgage Association
Purchase Details
Closed on
Apr 5, 2007
Sold by
Phillips Joe
Bought by
Comose Timothy A and Comose Cynthia A
Home Financials for this Owner
Home Financials are based on the most recent Mortgage that was taken out on this home.
Original Mortgage
$380,000
Interest Rate
6.1%
Mortgage Type
Purchase Money Mortgage
Purchase Details
Closed on
Aug 22, 2006
Sold by
Phillips Joe
Bought by
Phillips Joe
Create a Home Valuation Report for This Property
The Home Valuation Report is an in-depth analysis detailing your home's value as well as a comparison with similar homes in the area
Home Values in the Area
Average Home Value in this Area
Purchase History
| Date | Buyer | Sale Price | Title Company |
|---|---|---|---|
| Ward John C | $354,000 | -- | |
| Federal National Mortgage Association | $380,000 | -- | |
| Comose Timothy A | $475,000 | None Available | |
| Phillips Joe | -- | None Available |
Source: Public Records
Mortgage History
| Date | Status | Borrower | Loan Amount |
|---|---|---|---|
| Open | Ward John C | $336,300 | |
| Previous Owner | Comose Timothy A | $380,000 |
Source: Public Records
Tax History Compared to Growth
Tax History
| Year | Tax Paid | Tax Assessment Tax Assessment Total Assessment is a certain percentage of the fair market value that is determined by local assessors to be the total taxable value of land and additions on the property. | Land | Improvement |
|---|---|---|---|---|
| 2024 | $2,985 | $18,119 | $7,234 | $10,885 |
| 2023 | $2,772 | $18,119 | $7,234 | $10,885 |
| 2022 | $2,797 | $18,119 | $7,234 | $10,885 |
| 2020 | $2,929 | $18,119 | $7,234 | $10,885 |
| 2019 | $2,592 | $15,755 | $5,632 | $10,123 |
| 2018 | $2,282 | $15,755 | $5,632 | $10,123 |
| 2017 | $2,223 | $15,755 | $5,632 | $10,123 |
| 2016 | $2,279 | $15,755 | $5,632 | $10,123 |
| 2014 | $2,600 | $18,045 | $7,040 | $11,005 |
| 2013 | -- | $18,050 | $7,040 | $11,010 |
Source: Public Records
Map
Nearby Homes
- 123 Old Cedar Point
- 220 Old Cedar Point
- 0 Green Meadow Dr Unit 617154
- 0 Shamrock Ct Unit 617155
- 104 Keepers Ct
- 124 Parapet Trail
- 1778 Isle of Pines Dr
- 249 Daymark Dr
- 343 Night Harbor Dr
- 108 Quiet Cove Dr
- 251 Edgewood Dr
- 1304 Amicks Ferry Rd
- 1040 Night Harbor Cir
- 201 Edgewood Dr
- 117 Bogater Rd
- 530 Misty Banks Dr
- 108 Oak Trace Ct
- 105 Oak Trace Ct
- 216 Dawn Island Trail
- 0 Woodlake Cir
- 426 Quiet Pines Rd
- 212 Old Cedar Point
- 201 Old Cedar Point
- 200 Old Cedar Point
- 422 Quiet Pines Rd
- 127 Old Cedar Point
- 211 Old Cedar Point
- 214 Old Cedar Point
- 215 Old Cedar Point
- 418 Quiet Pines Rd
- 216 Old Cedar Point
- 219 Old Cedar Point
- 818 Green Meadow Dr
- 218 Old Cedar Point
- 0 Quiet Pines Dr Unit 220187
- 0 Quiet Pines Dr Unit 220185
- 0000 Quiet Pines Dr
- 0 Quiet Pines Rd Unit 235038
- 0 Quiet Pines Dr Unit 235036
- Lot 0 Quiet Pines Dr