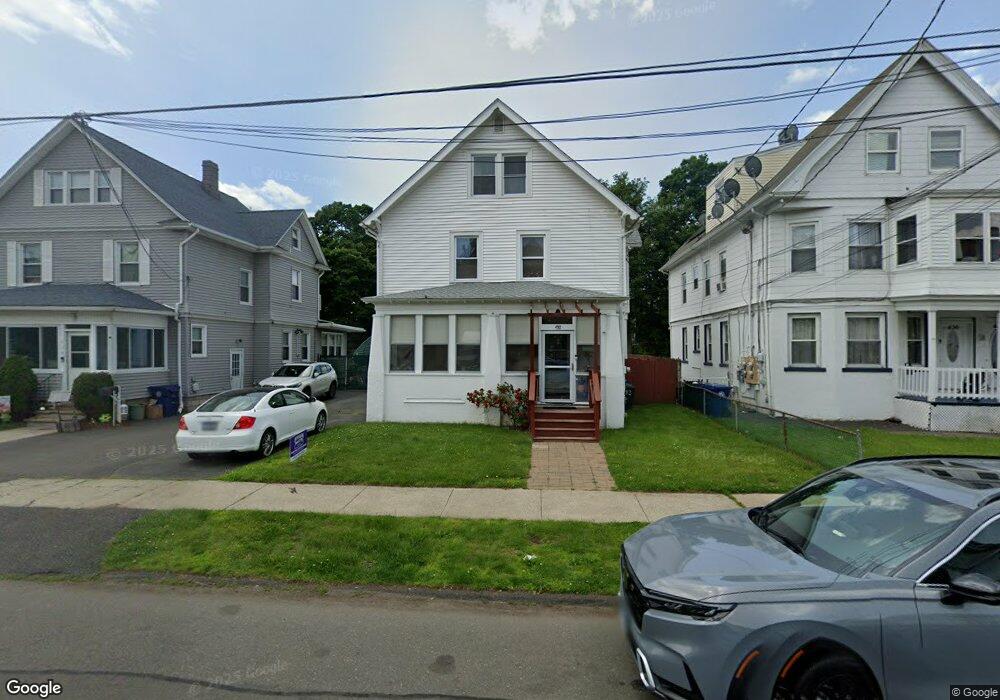
432 Union Ave West Haven, CT 06516
West Haven Center NeighborhoodEstimated Value: $348,000 - $375,000
3
Beds
2
Baths
2,117
Sq Ft
$172/Sq Ft
Est. Value
About This Home
This home is located at 432 Union Ave, West Haven, CT 06516 and is currently estimated at $364,896, approximately $172 per square foot. 432 Union Ave is a home located in New Haven County with nearby schools including Carrigan 5/6 Intermediate School, Harry M. Bailey Middle School, and West Haven High School.
Ownership History
Date
Name
Owned For
Owner Type
Purchase Details
Closed on
Dec 20, 1995
Sold by
Pantani Victor P
Bought by
Otero Yvette
Current Estimated Value
Home Financials for this Owner
Home Financials are based on the most recent Mortgage that was taken out on this home.
Original Mortgage
$90,900
Interest Rate
7.33%
Mortgage Type
Purchase Money Mortgage
Create a Home Valuation Report for This Property
The Home Valuation Report is an in-depth analysis detailing your home's value as well as a comparison with similar homes in the area
Home Values in the Area
Average Home Value in this Area
Purchase History
| Date | Buyer | Sale Price | Title Company |
|---|---|---|---|
| Otero Yvette | $91,000 | -- | |
| Otero Yvette | $91,000 | -- |
Source: Public Records
Mortgage History
| Date | Status | Borrower | Loan Amount |
|---|---|---|---|
| Open | Otero Yvette | $147,028 | |
| Closed | Otero Yvette | $160,000 | |
| Closed | Otero Yvette | $90,900 |
Source: Public Records
Tax History Compared to Growth
Tax History
| Year | Tax Paid | Tax Assessment Tax Assessment Total Assessment is a certain percentage of the fair market value that is determined by local assessors to be the total taxable value of land and additions on the property. | Land | Improvement |
|---|---|---|---|---|
| 2025 | $6,819 | $197,470 | $48,790 | $148,680 |
| 2024 | $6,344 | $130,760 | $33,740 | $97,020 |
| 2023 | $6,082 | $130,760 | $33,740 | $97,020 |
| 2022 | $5,963 | $130,760 | $33,740 | $97,020 |
| 2021 | $5,963 | $130,760 | $33,740 | $97,020 |
| 2020 | $5,660 | $112,140 | $26,390 | $85,750 |
| 2019 | $5,458 | $112,140 | $26,390 | $85,750 |
| 2018 | $5,411 | $112,140 | $26,390 | $85,750 |
| 2017 | $5,120 | $112,140 | $26,390 | $85,750 |
| 2016 | $5,109 | $112,140 | $26,390 | $85,750 |
| 2015 | $4,858 | $120,400 | $31,850 | $88,550 |
| 2014 | $4,828 | $120,400 | $31,850 | $88,550 |
Source: Public Records
Map
Nearby Homes
- 436 Union Ave
- 440 Union Ave
- 198 Wood St
- 420 Union Ave
- 438 Union Ave Unit 2 floor
- 438 Union Ave Unit 3floor
- 438 Union Ave
- 414 Union Ave
- 408 Union Ave
- 429 Union Ave
- 435 Union Ave
- 423 Union Ave
- 404 Union Ave
- 417 Union Ave
- 413 Union Ave
- 735 Washington Ave
- 409 Union Ave
- 396 Union Ave
- 729 Washington Ave
- 153 Wood St