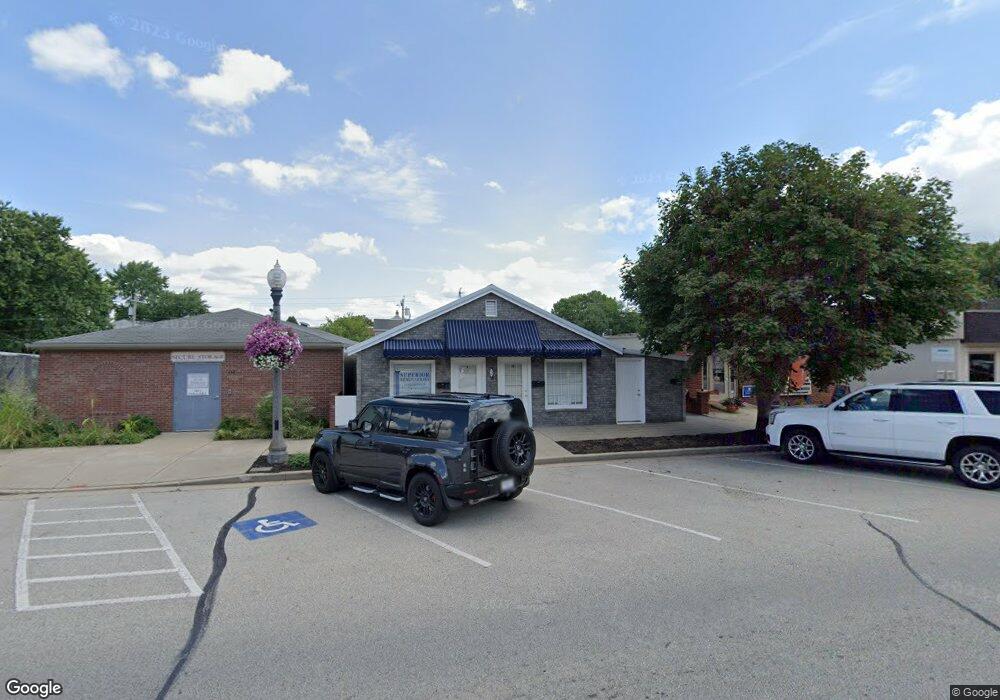
432 Walnut St Lawrenceburg, IN 47025
Estimated Value: $156,000 - $210,000
1
Bed
3
Baths
808
Sq Ft
$224/Sq Ft
Est. Value
About This Home
This home is located at 432 Walnut St, Lawrenceburg, IN 47025 and is currently estimated at $180,987, approximately $223 per square foot. 432 Walnut St is a home with nearby schools including Lawrenceburg Primary School, Central Elementary School, and Greendale Middle School.
Ownership History
Date
Name
Owned For
Owner Type
Purchase Details
Closed on
Dec 19, 2022
Sold by
Stutler Danielle D
Bought by
Hudson Faron W
Current Estimated Value
Purchase Details
Closed on
Feb 2, 2021
Sold by
Hudson Faron W
Bought by
Hudson Faron W and Stutler Danielle D
Purchase Details
Closed on
Jan 6, 2012
Sold by
Hudson Sheila L
Bought by
Hudson Faron W
Purchase Details
Closed on
Jun 21, 2007
Sold by
Race John and Deck Rosella M
Bought by
Hudson Faron W and Hudson Sheila L
Home Financials for this Owner
Home Financials are based on the most recent Mortgage that was taken out on this home.
Original Mortgage
$62,000
Interest Rate
6.42%
Mortgage Type
Commercial
Create a Home Valuation Report for This Property
The Home Valuation Report is an in-depth analysis detailing your home's value as well as a comparison with similar homes in the area
Home Values in the Area
Average Home Value in this Area
Purchase History
| Date | Buyer | Sale Price | Title Company |
|---|---|---|---|
| Hudson Faron W | -- | -- | |
| Hudson Faron W | -- | None Available | |
| Hudson Faron W | $9,000 | -- | |
| Hudson Faron W | -- | -- |
Source: Public Records
Mortgage History
| Date | Status | Borrower | Loan Amount |
|---|---|---|---|
| Previous Owner | Hudson Faron W | $62,000 |
Source: Public Records
Tax History Compared to Growth
Tax History
| Year | Tax Paid | Tax Assessment Tax Assessment Total Assessment is a certain percentage of the fair market value that is determined by local assessors to be the total taxable value of land and additions on the property. | Land | Improvement |
|---|---|---|---|---|
| 2024 | $2,455 | $90,300 | $45,600 | $44,700 |
| 2023 | $2,470 | $90,900 | $45,600 | $45,300 |
| 2022 | $2,385 | $90,200 | $45,600 | $44,600 |
| 2021 | $2,360 | $86,300 | $45,600 | $40,700 |
| 2020 | $2,247 | $86,300 | $45,600 | $40,700 |
| 2019 | $2,023 | $86,300 | $45,600 | $40,700 |
| 2018 | $2,040 | $86,300 | $45,600 | $40,700 |
| 2017 | $2,003 | $85,400 | $45,600 | $39,800 |
| 2016 | $2,002 | $85,400 | $45,600 | $39,800 |
| 2014 | $1,863 | $84,600 | $45,600 | $39,000 |
Source: Public Records
Map
Nearby Homes