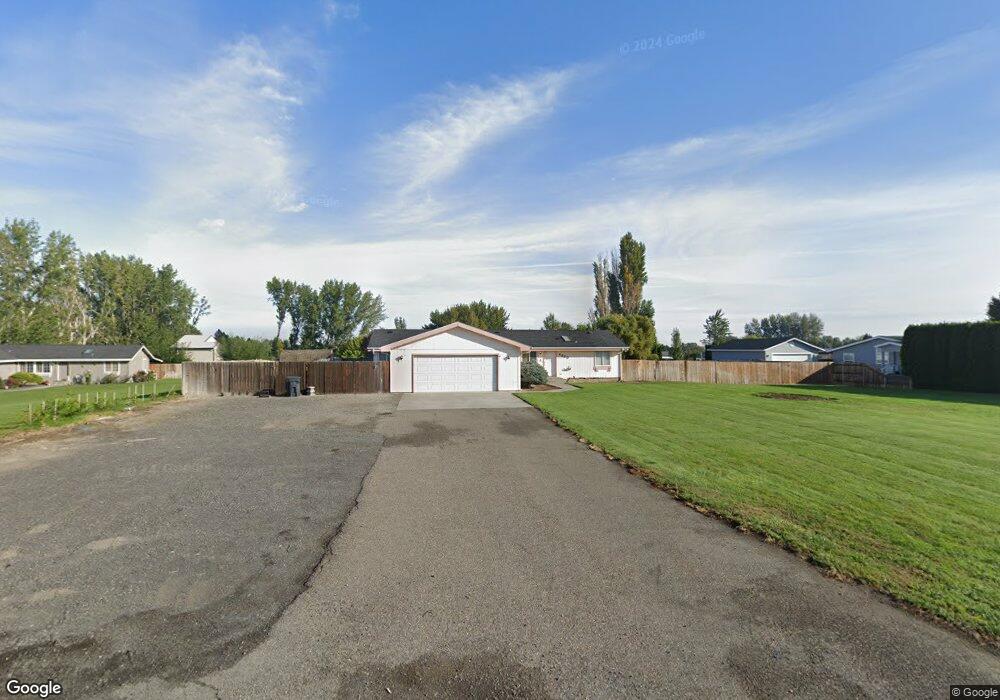
4320 Kennedy Rd West Richland, WA 99353
Estimated Value: $219,000 - $499,000
3
Beds
2
Baths
1,500
Sq Ft
$255/Sq Ft
Est. Value
About This Home
This home is located at 4320 Kennedy Rd, West Richland, WA 99353 and is currently estimated at $382,037, approximately $254 per square foot. 4320 Kennedy Rd is a home located in Benton County with nearby schools including White Bluffs Elementary School, Enterprise Middle School, and Richland High School.
Ownership History
Date
Name
Owned For
Owner Type
Purchase Details
Closed on
May 7, 2025
Sold by
Cobb Diana E
Bought by
Gonzalez Magdaleno Zermeno and Alvarez Claudia Sulai
Current Estimated Value
Purchase Details
Closed on
Sep 2, 2014
Sold by
Cobb Diana E
Bought by
Cobb Diana E
Purchase Details
Closed on
May 22, 2013
Sold by
Cobb Donald H and Cobb Flora M
Bought by
Cobb Kevin L and Cobb Diana E
Purchase Details
Closed on
Jan 28, 2010
Sold by
Beaver Jack C and Beaver Lisa A
Bought by
Cobb Donald H and Cobb Flora M
Purchase Details
Closed on
Mar 14, 2008
Sold by
Beaver Lisa A and Clensy Lisa A
Bought by
Beaver Jack C and Beaver Lisa A
Home Financials for this Owner
Home Financials are based on the most recent Mortgage that was taken out on this home.
Original Mortgage
$145,601
Interest Rate
5.65%
Mortgage Type
Stand Alone Refi Refinance Of Original Loan
Create a Home Valuation Report for This Property
The Home Valuation Report is an in-depth analysis detailing your home's value as well as a comparison with similar homes in the area
Home Values in the Area
Average Home Value in this Area
Purchase History
| Date | Buyer | Sale Price | Title Company |
|---|---|---|---|
| Gonzalez Magdaleno Zermeno | $220,000 | Chicago Title | |
| Cobb Diana E | -- | None Available | |
| Cobb Kevin L | -- | None Available | |
| Cobb Donald H | $153,500 | Cascade Title | |
| Beaver Jack C | -- | Chicago Title |
Source: Public Records
Mortgage History
| Date | Status | Borrower | Loan Amount |
|---|---|---|---|
| Previous Owner | Beaver Jack C | $145,601 |
Source: Public Records
Tax History Compared to Growth
Tax History
| Year | Tax Paid | Tax Assessment Tax Assessment Total Assessment is a certain percentage of the fair market value that is determined by local assessors to be the total taxable value of land and additions on the property. | Land | Improvement |
|---|---|---|---|---|
| 2024 | $2,364 | $231,150 | $85,000 | $146,150 |
| 2023 | $2,364 | $219,910 | $85,000 | $134,910 |
| 2022 | $2,548 | $204,920 | $85,000 | $119,920 |
| 2021 | $2,657 | $204,920 | $85,000 | $119,920 |
| 2020 | $2,815 | $204,920 | $85,000 | $119,920 |
| 2019 | $1,825 | $208,670 | $85,000 | $123,670 |
| 2018 | $2,104 | $144,350 | $40,000 | $104,350 |
| 2017 | $1,860 | $144,350 | $40,000 | $104,350 |
| 2016 | $2,327 | $144,350 | $40,000 | $104,350 |
| 2015 | $2,346 | $144,350 | $40,000 | $104,350 |
| 2014 | -- | $144,350 | $40,000 | $104,350 |
| 2013 | -- | $144,350 | $40,000 | $104,350 |
Source: Public Records
Map
Nearby Homes
- 3700 Arena Rd
- 3807 E Lattin Rd
- 20906 Bretz Prairie NE
- 28509 Dallas Rd
- 28605 Dallas Rd
- 4821 Starburst Ct
- 4949 Rau Ln
- 3909 Curtis Dr
- 900 Cayuse Dr
- 5330 Hershey Ln
- 5420 Hershey Ln
- 4005 Cascade Dr
- 1004 Sirron Ave
- 1020 Chinook Dr
- 5188 Pinehurst St
- 3538 Curtis Dr
- 70022 E 669 Prairie NE
- 1058 Klikitat St
- 3413 Eastlake Dr
- 1063 Klamath Ct
- 4210 Kennedy Rd
- 4330 Kennedy Rd
- 4345 Twin Lake Ct
- 4235 Twin Lake Ct
- 4235 Twin Lake Ct
- 4225 Twin Lake Ct
- 4215 Twin Lake Ct
- 4215 Twin Lake Ct Unit Beautiful home on 1
- 4420 Angel Lake Ct
- 4410 Angel Lake Ct
- 4100 Jenny Lake Ct
- 4201 Kennedy Rd
- 4201 Kennedy Rd Unit Suite 2
- 4101 Jenny Lake Ct
- 4220 Twin Lake Ct
- 4320 Angel Lake Ct
- 4340 Twin Lake Ct
- 4230 Twin Lake Ct
- 4230 Twin Lake Ct
- 4210 Twin Lake Ct