4320 N Stonecrossing Provo, UT 84604
Riverside NeighborhoodEstimated Value: $1,559,000 - $1,728,288
5
Beds
6
Baths
6,994
Sq Ft
$235/Sq Ft
Est. Value
About This Home
This home is located at 4320 N Stonecrossing, Provo, UT 84604 and is currently estimated at $1,644,096, approximately $235 per square foot. 4320 N Stonecrossing is a home located in Utah County with nearby schools including Canyon Crest Elementary School, Centennial Middle School, and Timpview High School.
Ownership History
Date
Name
Owned For
Owner Type
Purchase Details
Closed on
Oct 5, 2009
Sold by
Haggberg Edward Stephen
Bought by
Winger Frank and Winger Cathy
Current Estimated Value
Home Financials for this Owner
Home Financials are based on the most recent Mortgage that was taken out on this home.
Original Mortgage
$708,750
Interest Rate
5.02%
Mortgage Type
New Conventional
Purchase Details
Closed on
Jan 16, 2008
Sold by
Behunin Brent B and Behunin Camille
Bought by
Haggberg Edward Stephen
Home Financials for this Owner
Home Financials are based on the most recent Mortgage that was taken out on this home.
Original Mortgage
$1,266,000
Interest Rate
6.07%
Mortgage Type
Unknown
Purchase Details
Closed on
Aug 12, 2005
Sold by
Stone Gate Lc
Bought by
Behunin Brent B and Behunin Camille
Home Financials for this Owner
Home Financials are based on the most recent Mortgage that was taken out on this home.
Original Mortgage
$930,000
Interest Rate
5.56%
Mortgage Type
Construction
Create a Home Valuation Report for This Property
The Home Valuation Report is an in-depth analysis detailing your home's value as well as a comparison with similar homes in the area
Home Values in the Area
Average Home Value in this Area
Purchase History
| Date | Buyer | Sale Price | Title Company |
|---|---|---|---|
| Winger Frank | -- | First American-American F | |
| Haggberg Edward Stephen | -- | Equity Title Production F | |
| Behunin Brent B | -- | First American Title Agency |
Source: Public Records
Mortgage History
| Date | Status | Borrower | Loan Amount |
|---|---|---|---|
| Closed | Winger Frank | $708,750 | |
| Previous Owner | Haggberg Edward Stephen | $1,266,000 | |
| Previous Owner | Behunin Brent B | $930,000 |
Source: Public Records
Tax History Compared to Growth
Tax History
| Year | Tax Paid | Tax Assessment Tax Assessment Total Assessment is a certain percentage of the fair market value that is determined by local assessors to be the total taxable value of land and additions on the property. | Land | Improvement |
|---|---|---|---|---|
| 2025 | $9,077 | $966,020 | $330,900 | $1,425,500 |
| 2024 | $9,077 | $893,530 | $0 | $0 |
| 2023 | $8,534 | $828,630 | $0 | $0 |
| 2022 | $7,583 | $742,005 | $0 | $0 |
| 2021 | $6,279 | $1,071,500 | $280,000 | $791,500 |
| 2020 | $6,649 | $1,063,700 | $280,000 | $783,700 |
| 2019 | $6,393 | $1,063,700 | $280,000 | $783,700 |
| 2018 | $6,109 | $1,030,800 | $280,000 | $750,800 |
| 2017 | $6,114 | $566,940 | $0 | $0 |
| 2016 | $6,465 | $558,745 | $0 | $0 |
| 2015 | $6,119 | $534,545 | $0 | $0 |
| 2014 | $5,086 | $463,155 | $0 | $0 |
Source: Public Records
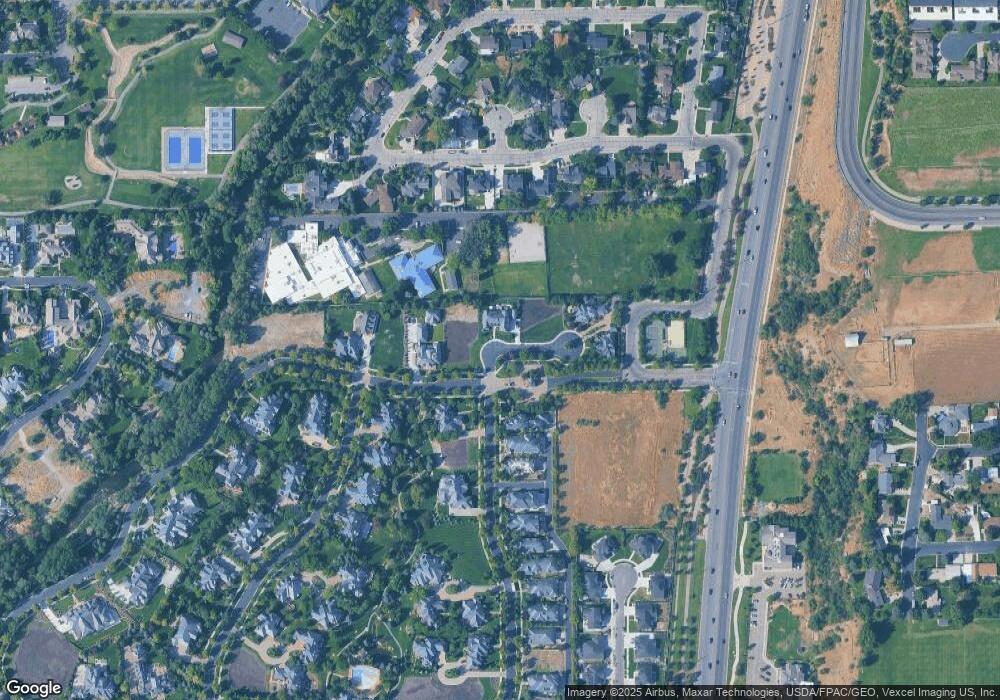
Map
Nearby Homes
- 4246 N Stonecrossing
- 4252 N Edgewood Cir Unit 12`
- 282 W 4020 N
- 455 W 4150 St N
- 179 E 4635 N
- 355 W 4020 N
- 645 Foothill Dr
- 4161 N Canyon Rd Unit 2
- 209 E 4735 N
- 221 E 4735 N
- 299 E 4000 N
- 325 S 1000 E
- 1070 E 120 S
- 387 S 1000 E
- 153 S 1000 E
- 407 E 3900 Rd N Unit 1
- 407 E 3900 Rd N
- 131 W Village Ln
- 350 S 900 E
- 3535 N 160 St W
- 4320 N Stonecrossing Unit 70
- 4320 Stonecrossing
- 4334 N Stonecrossing Unit 69
- 4334 N Stonecrossing Unit 69
- 4334 N Stonecrossing Unit 69
- 4308 N Stonecrossing Unit 71
- 4308 N Stonecrossing
- 4308 Stonecrossing
- 102 Stone Crossing
- 4296 N Stonecrossing
- 4296 N Stonecrossing Unit 72
- 4296 Stonecrossing
- 4352 Stonecrossing
- 4352 N Stonecrossing
- 4352 N Stonecrossing Unit 68
- 4352 N Stonecrossing
- 4284 N Stonecrossing
- 4284 N Stonecrossing
- 4284 Stonecrossing
- 4337 N Stonecrossing