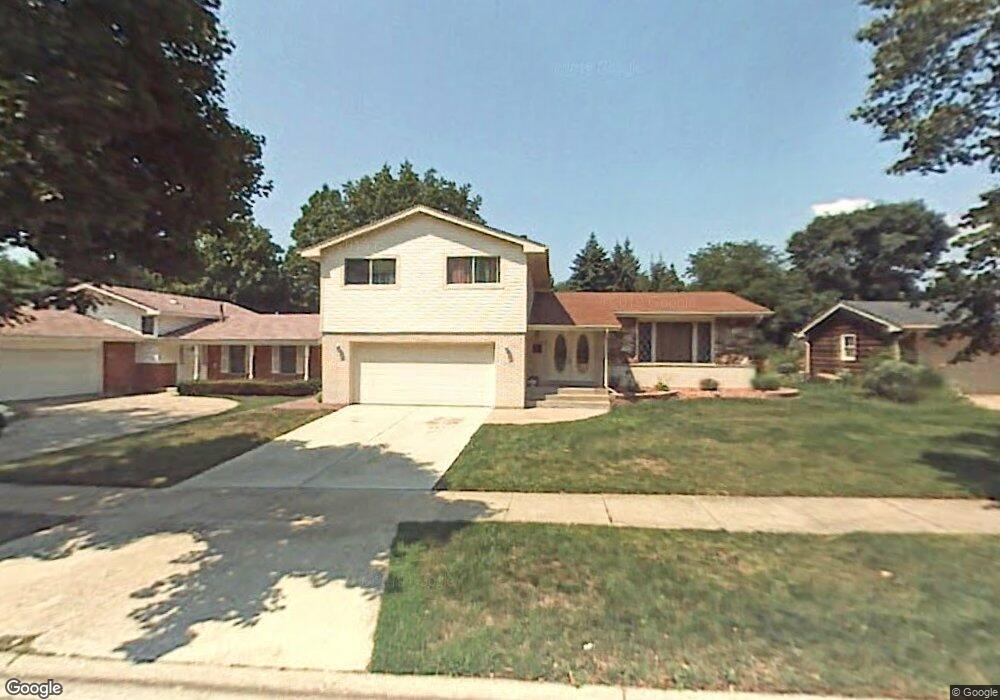
4320 Oakwood Ln Matteson, IL 60443
Old Matteson NeighborhoodEstimated Value: $288,000 - $305,000
4
Beds
3
Baths
1,766
Sq Ft
$166/Sq Ft
Est. Value
About This Home
This home is located at 4320 Oakwood Ln, Matteson, IL 60443 and is currently estimated at $292,570, approximately $165 per square foot. 4320 Oakwood Ln is a home located in Cook County with nearby schools including Illinois School, Arcadia Elementary School, and Indiana Elementary School.
Ownership History
Date
Name
Owned For
Owner Type
Purchase Details
Closed on
Nov 1, 2001
Sold by
Hud
Bought by
Pollard Rosamond
Current Estimated Value
Home Financials for this Owner
Home Financials are based on the most recent Mortgage that was taken out on this home.
Original Mortgage
$138,170
Outstanding Balance
$53,685
Interest Rate
6.64%
Mortgage Type
FHA
Estimated Equity
$238,885
Purchase Details
Closed on
Dec 29, 2000
Sold by
Hill
Bought by
Hud
Purchase Details
Closed on
Mar 25, 1996
Sold by
Hornsby Alice L
Bought by
Hill Nicole
Home Financials for this Owner
Home Financials are based on the most recent Mortgage that was taken out on this home.
Original Mortgage
$140,773
Interest Rate
7.73%
Mortgage Type
FHA
Purchase Details
Closed on
Jul 7, 1994
Sold by
Federal National Mortgage Association
Bought by
Hornsby Alice L
Home Financials for this Owner
Home Financials are based on the most recent Mortgage that was taken out on this home.
Original Mortgage
$105,000
Interest Rate
8.59%
Create a Home Valuation Report for This Property
The Home Valuation Report is an in-depth analysis detailing your home's value as well as a comparison with similar homes in the area
Home Values in the Area
Average Home Value in this Area
Purchase History
| Date | Buyer | Sale Price | Title Company |
|---|---|---|---|
| Pollard Rosamond | -- | Stewart Title Company | |
| Hud | -- | -- | |
| Hill Nicole | -- | -- | |
| Hornsby Alice L | -- | -- |
Source: Public Records
Mortgage History
| Date | Status | Borrower | Loan Amount |
|---|---|---|---|
| Open | Pollard Rosamond | $138,170 | |
| Previous Owner | Hill Nicole | $140,773 | |
| Previous Owner | Hornsby Alice L | $105,000 |
Source: Public Records
Tax History Compared to Growth
Tax History
| Year | Tax Paid | Tax Assessment Tax Assessment Total Assessment is a certain percentage of the fair market value that is determined by local assessors to be the total taxable value of land and additions on the property. | Land | Improvement |
|---|---|---|---|---|
| 2024 | $8,549 | $24,000 | $3,251 | $20,749 |
| 2023 | $5,474 | $24,000 | $3,251 | $20,749 |
| 2022 | $5,474 | $13,513 | $2,845 | $10,668 |
| 2021 | $5,599 | $13,511 | $2,844 | $10,667 |
| 2020 | $5,583 | $14,064 | $2,844 | $11,220 |
| 2019 | $6,744 | $16,460 | $2,641 | $13,819 |
| 2018 | $6,740 | $16,460 | $2,641 | $13,819 |
| 2017 | $6,500 | $16,460 | $2,641 | $13,819 |
| 2016 | $5,760 | $14,211 | $2,438 | $11,773 |
| 2015 | $5,649 | $14,211 | $2,438 | $11,773 |
| 2014 | $5,497 | $14,211 | $2,438 | $11,773 |
| 2013 | $5,520 | $15,419 | $2,438 | $12,981 |
Source: Public Records
Map
Nearby Homes
- 4325 Oakwood Ln
- 4329 Applewood Ln
- 4228 Applewood Ln
- 4335 Lindenwood Dr
- 820 School Ave
- 4110 Applewood Ln
- 4108 Applewood Ln
- 663 Primrose Ln
- 706 Carnation Ln
- 858 Academy Ave
- 831 Violet Ln
- 4613 Lindenwood Ct
- 820 Exmoor Rd
- 20520 Crawford Ave
- 4200 Washington Ave
- 4500 203rd St
- 20920 Governors Hwy
- 20340 Crawford Ave
- 3919 214th St
- 312 Grafton Place
- 4326 Oakwood Ln
- 4316 Oakwood Ln
- 4321 Cedarwood Ln
- 4332 Oakwood Ln
- 4310 Oakwood Ln
- 4327 Cedarwood Ln
- 4315 Cedarwood Ln
- 4331 Cedarwood Ln
- 4321 Oakwood Ln
- 4309 Cedarwood Ln
- 4315 Oakwood Ln
- 4306 Oakwood Ln
- 819 Kostner Ave
- 4311 Oakwood Ln
- 809 Kostner Ave
- 4331 Oakwood Ln
- 4305 Cedarwood Ln
- 4300 Oakwood Ln
- 833 Kostner Ave
- 4251 Cedarwood Ln