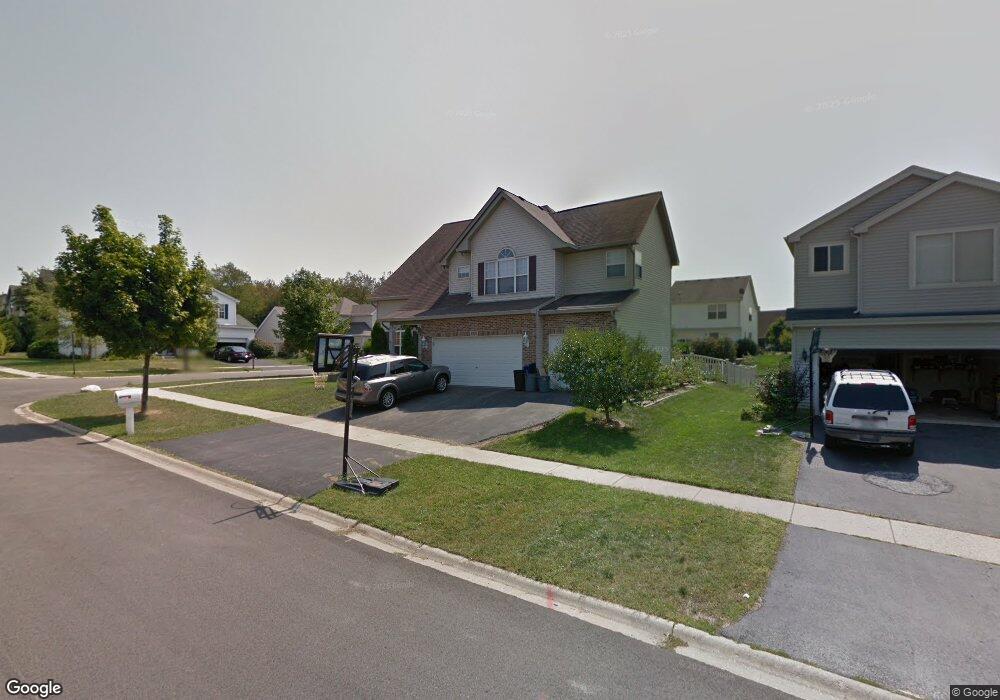
4320 Rolling Hills Dr Unit 5 Lake In the Hills, IL 60156
Estimated Value: $424,000 - $460,320
3
Beds
4
Baths
2,464
Sq Ft
$177/Sq Ft
Est. Value
About This Home
This home is located at 4320 Rolling Hills Dr Unit 5, Lake In the Hills, IL 60156 and is currently estimated at $436,830, approximately $177 per square foot. 4320 Rolling Hills Dr Unit 5 is a home located in McHenry County with nearby schools including Mackeben Elementary School, Conley Elementary School, and Heineman Middle School.
Ownership History
Date
Name
Owned For
Owner Type
Purchase Details
Closed on
Oct 16, 2014
Sold by
Spivey Kristine
Bought by
Spivey James
Current Estimated Value
Purchase Details
Closed on
Apr 27, 2011
Sold by
Fannie Mae
Bought by
Spivey James
Home Financials for this Owner
Home Financials are based on the most recent Mortgage that was taken out on this home.
Original Mortgage
$206,000
Interest Rate
4.63%
Mortgage Type
VA
Purchase Details
Closed on
Aug 6, 2010
Sold by
Comstock
Bought by
Federal National Mortgage Association
Purchase Details
Closed on
Oct 20, 1998
Sold by
Bayberry Development Company Ii Inc
Bought by
Comstock Robert A and Comstock Jennifer C
Home Financials for this Owner
Home Financials are based on the most recent Mortgage that was taken out on this home.
Original Mortgage
$36,000
Interest Rate
7.25%
Create a Home Valuation Report for This Property
The Home Valuation Report is an in-depth analysis detailing your home's value as well as a comparison with similar homes in the area
Home Values in the Area
Average Home Value in this Area
Purchase History
| Date | Buyer | Sale Price | Title Company |
|---|---|---|---|
| Spivey James | -- | None Available | |
| Spivey James | $206,000 | Attorneys Title Guaranty Fun | |
| Federal National Mortgage Association | $220,399 | None Available | |
| Comstock Robert A | $45,000 | -- |
Source: Public Records
Mortgage History
| Date | Status | Borrower | Loan Amount |
|---|---|---|---|
| Previous Owner | Spivey James | $206,000 | |
| Previous Owner | Comstock Robert A | $36,000 |
Source: Public Records
Tax History Compared to Growth
Tax History
| Year | Tax Paid | Tax Assessment Tax Assessment Total Assessment is a certain percentage of the fair market value that is determined by local assessors to be the total taxable value of land and additions on the property. | Land | Improvement |
|---|---|---|---|---|
| 2024 | -- | $126,212 | $6,989 | $119,223 |
| 2023 | $4,271 | $113,377 | $6,278 | $107,099 |
| 2022 | $4,271 | $103,239 | $5,717 | $97,522 |
| 2021 | $4,271 | $97,230 | $5,384 | $91,846 |
| 2020 | $7,768 | $94,637 | $5,240 | $89,397 |
| 2019 | $7,580 | $92,221 | $5,106 | $87,115 |
| 2018 | $7,427 | $88,784 | $5,747 | $83,037 |
| 2017 | $7,284 | $83,672 | $5,416 | $78,256 |
| 2016 | $7,350 | $79,551 | $5,149 | $74,402 |
| 2013 | -- | $68,111 | $10,531 | $57,580 |
Source: Public Records
Map
Nearby Homes
- 10 Barrington Ct
- 1578 Grouse Way
- 9103 Miller Rd Unit 4
- 9103 Miller Rd Unit 5
- 9103 Miller Rd Unit 3
- 9103 Miller Rd Unit 2
- 9103 Miller Rd Unit 1
- 10 Ronan Ct
- 20 Dogwood Ct
- 9012 Swanson Rd
- 4535 Heron Dr
- 1484 Rolling Hills Dr
- 1657 Flagstone Dr
- 2948 Impressions Dr
- 3218 Impressions Dr
- 2191 Litchfield Ln
- 1582 Dogwood Dr Unit 4
- 2521 Waterford Ln
- 2 Melbourne Ct
- 769 White Pine Cir
- 1453 Deer Creek Ln
- 4340 Rolling Hills Dr
- 1443 Deer Creek Ln
- 1452 Deer Creek Ln
- 1442 Deer Creek Ln
- 4333 Rolling Hills Dr
- 4323 Rolling Hills Dr
- 2 Sugar Creek Ct
- 1432 Deer Creek Ln
- 4350 Rolling Hills Dr
- 1433 Deer Creek Ln
- 9 Walnut Grove Ct
- 4303 Rolling Hills Dr
- 4 Sugar Creek Ct
- 11 Walnut Grove Ct
- 4360 Rolling Hills Dr
- 8 Sugar Creek Ct
- 1749 Rolling Hills Dr
- 1516 Alexandra Blvd
- 7 Walnut Grove Ct Unit 4