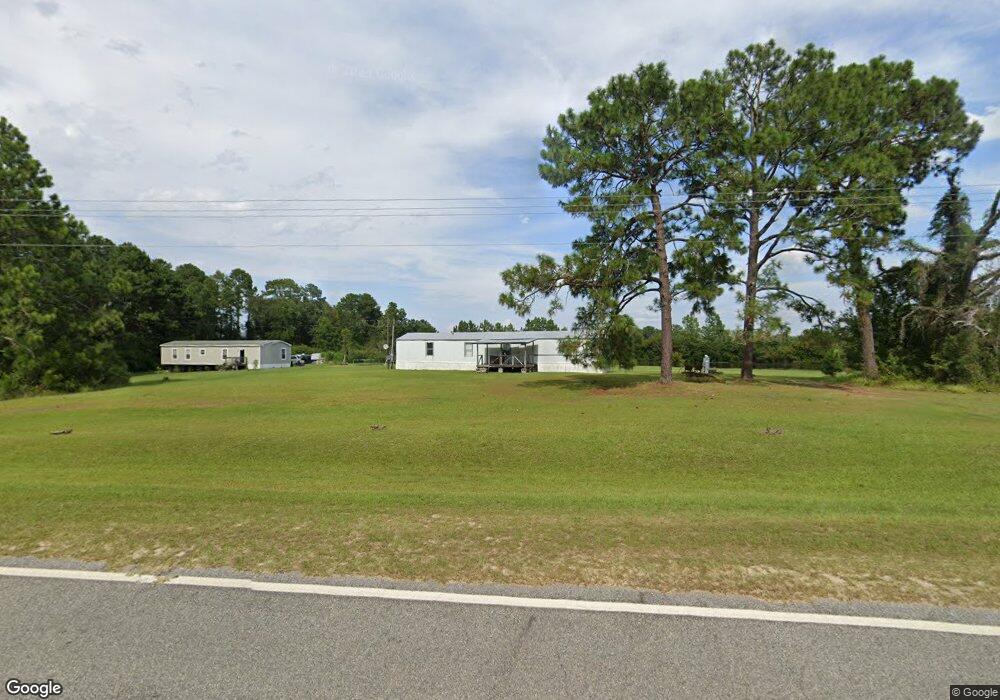
4320 Sapps Lake Rd Enigma, GA 31749
Estimated Value: $60,337 - $107,000
3
Beds
1
Bath
1,216
Sq Ft
$64/Sq Ft
Est. Value
About This Home
This home is located at 4320 Sapps Lake Rd, Enigma, GA 31749 and is currently estimated at $77,334, approximately $63 per square foot. 4320 Sapps Lake Rd is a home with nearby schools including Berrien Primary School, Berrien Elementary School, and Berrien Middle School.
Ownership History
Date
Name
Owned For
Owner Type
Purchase Details
Closed on
Dec 11, 2019
Sold by
Harnage Samantha Leann
Bought by
Cranford Samantha Leann and Cranford Terry Dee
Current Estimated Value
Home Financials for this Owner
Home Financials are based on the most recent Mortgage that was taken out on this home.
Original Mortgage
$22,299
Interest Rate
3.7%
Mortgage Type
New Conventional
Purchase Details
Closed on
Apr 15, 2011
Sold by
Joyce Richard D
Bought by
Harnage Samantha Leann
Purchase Details
Closed on
Sep 22, 2006
Sold by
Gaither David Aaron
Bought by
Jayce Richard D
Home Financials for this Owner
Home Financials are based on the most recent Mortgage that was taken out on this home.
Original Mortgage
$40,000
Interest Rate
6.46%
Mortgage Type
New Conventional
Purchase Details
Closed on
Jun 10, 2002
Sold by
Mcdaniel Herman
Bought by
Gaither David Aaron
Purchase Details
Closed on
Mar 1, 2001
Sold by
Patrick Elizabeth Estate
Bought by
Mcdaniel Herman
Create a Home Valuation Report for This Property
The Home Valuation Report is an in-depth analysis detailing your home's value as well as a comparison with similar homes in the area
Home Values in the Area
Average Home Value in this Area
Purchase History
| Date | Buyer | Sale Price | Title Company |
|---|---|---|---|
| Cranford Samantha Leann | -- | -- | |
| Harnage Samantha Leann | $50,000 | -- | |
| Jayce Richard D | $48,000 | -- | |
| Gaither David Aaron | $30,000 | -- | |
| Mcdaniel Herman | $174,400 | -- |
Source: Public Records
Mortgage History
| Date | Status | Borrower | Loan Amount |
|---|---|---|---|
| Closed | Cranford Samantha Leann | $22,299 | |
| Previous Owner | Jayce Richard D | $40,000 |
Source: Public Records
Tax History Compared to Growth
Tax History
| Year | Tax Paid | Tax Assessment Tax Assessment Total Assessment is a certain percentage of the fair market value that is determined by local assessors to be the total taxable value of land and additions on the property. | Land | Improvement |
|---|---|---|---|---|
| 2024 | $303 | $9,677 | $7,970 | $1,707 |
| 2023 | $304 | $9,677 | $7,970 | $1,707 |
| 2022 | $304 | $1,506 | $0 | $1,506 |
| 2021 | $306 | $1,506 | $0 | $1,506 |
| 2020 | $294 | $1,767 | $0 | $1,767 |
| 2019 | $294 | $1,767 | $0 | $1,767 |
| 2018 | $154 | $4,998 | $0 | $4,998 |
| 2017 | $294 | $2,039 | $0 | $2,039 |
| 2016 | $384 | $14,450 | $7,970 | $6,480 |
| 2015 | -- | $10,656 | $7,970 | $2,686 |
| 2014 | -- | $10,656 | $7,970 | $2,686 |
| 2013 | -- | $0 | $0 | $0 |
Source: Public Records
Map
Nearby Homes
- 287 Brookfield Nashville Rd
- 204 Brookfield Nashville Rd
- 58 Honeysuckle Ln
- 21 Brookfield-Lenox Rd
- 2242 U S 82
- 2635 Brookfield-Lenox Rd
- 3365 Chula Brookfield Rd
- 395 Harris St
- 69 Branch Ln
- 0 Baker Rd
- 720 Vanceville County Line Rd
- 1922 Turner Church Rd
- 0 E 0 Hwy 125 S
- 39 Paradise Lake Rd
- 5 Paradise Lake Rd
- 2066 U S 82
- 339 Chapel Hill Cir Unit 15
- 339 Chapel Hill Cir
- 406 Old Brookfield Rd E
- 2264 Spurlock Rd
- 4162 Sapps Lake Rd
- 4160 Sapps Lake Rd
- 4092 Sapps Lake Rd
- 4523 Sapps Lake Rd
- 3996 Sapps Lake Rd
- 3902 Sapps Lake Rd
- 3840 Sapps Lake Rd
- 3958 Sapps Lake Rd
- 5025 Sapps Lake Rd
- 3660 Sapps Lake Rd
- 3858 Sapps Lake Rd
- 2394 Us Highway 82 E
- 3858 Sapps Lake Rd
- 3565 Sapps Lake Rd
- 77 Po Box
- 2416 Edgar Drew Dorminey Rd