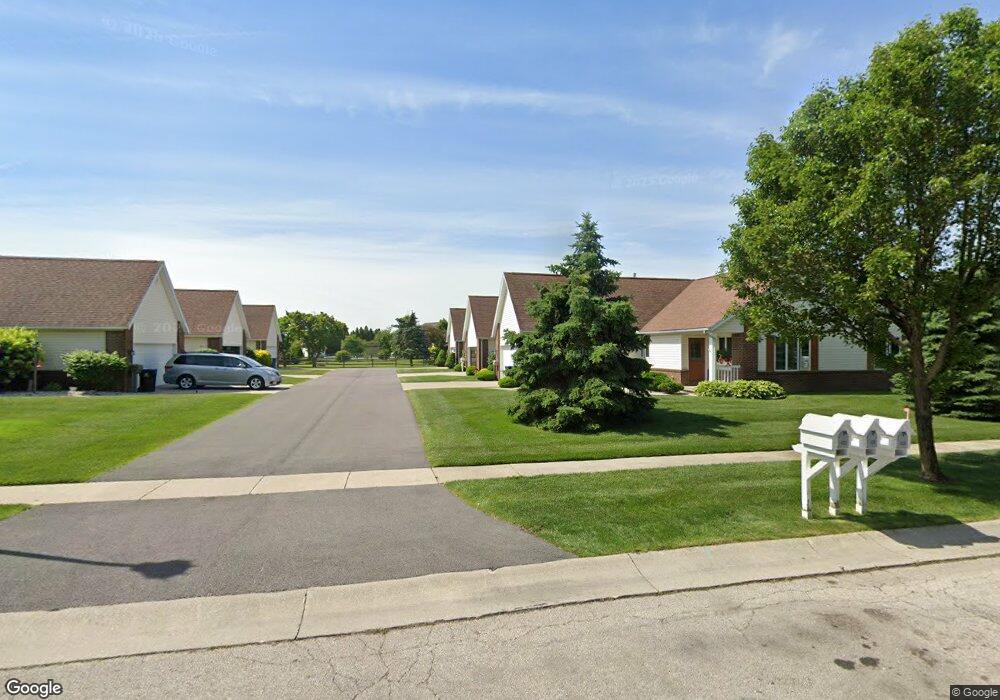
4320 Townhouse Dr Unit B Oregon, OH 43616
Estimated Value: $229,000 - $250,000
2
Beds
2
Baths
1,493
Sq Ft
$162/Sq Ft
Est. Value
About This Home
This home is located at 4320 Townhouse Dr Unit B, Oregon, OH 43616 and is currently estimated at $241,155, approximately $161 per square foot. 4320 Townhouse Dr Unit B is a home located in Lucas County with nearby schools including St. Kateri Catholic Schools and First St. John Day School.
Ownership History
Date
Name
Owned For
Owner Type
Purchase Details
Closed on
Mar 7, 2017
Sold by
Reynolds Phyllis L and Reynolds Lewis Jackson
Bought by
Reynolds Phyllis L
Current Estimated Value
Purchase Details
Closed on
Mar 1, 2017
Sold by
Reynolds Lewis Jackson and Reynolds Phyllis L
Bought by
Reynolds Phyllis L
Purchase Details
Closed on
Jun 14, 2013
Sold by
Reynolds Jackson L and Reynolds Phyllis L
Bought by
Reynolds Jackson L and Reynolds Phyllis L
Purchase Details
Closed on
May 25, 2011
Sold by
Leonhardt Beverly J
Bought by
Reynolds Jackson L and Reynolds Phyllis L
Purchase Details
Closed on
Jun 14, 2006
Sold by
Golembiewski Donna J
Bought by
Schlageter Patricia A
Home Financials for this Owner
Home Financials are based on the most recent Mortgage that was taken out on this home.
Original Mortgage
$30,000
Interest Rate
6.73%
Mortgage Type
Unknown
Purchase Details
Closed on
Aug 25, 2003
Sold by
Heilman David and Heilman Cynthia L
Bought by
Brewer Barbara A
Create a Home Valuation Report for This Property
The Home Valuation Report is an in-depth analysis detailing your home's value as well as a comparison with similar homes in the area
Home Values in the Area
Average Home Value in this Area
Purchase History
| Date | Buyer | Sale Price | Title Company |
|---|---|---|---|
| Reynolds Phyllis L | -- | None Available | |
| Reynolds Phyllis L | -- | None Available | |
| Reynolds Jackson L | -- | None Available | |
| Reynolds Jackson L | $125,000 | Chicago Title | |
| Schlageter Patricia A | $155,000 | None Available | |
| Brewer Barbara A | $164,000 | Northwest Title Agency Of Oh |
Source: Public Records
Mortgage History
| Date | Status | Borrower | Loan Amount |
|---|---|---|---|
| Previous Owner | Schlageter Patricia A | $30,000 |
Source: Public Records
Tax History Compared to Growth
Tax History
| Year | Tax Paid | Tax Assessment Tax Assessment Total Assessment is a certain percentage of the fair market value that is determined by local assessors to be the total taxable value of land and additions on the property. | Land | Improvement |
|---|---|---|---|---|
| 2024 | $1,527 | $73,570 | $17,185 | $56,385 |
| 2023 | $2,360 | $50,925 | $14,280 | $36,645 |
| 2022 | $2,399 | $50,925 | $14,280 | $36,645 |
| 2021 | $2,418 | $50,925 | $14,280 | $36,645 |
| 2020 | $2,462 | $46,935 | $11,935 | $35,000 |
| 2019 | $2,449 | $46,935 | $11,935 | $35,000 |
| 2018 | $2,402 | $46,935 | $11,935 | $35,000 |
| 2017 | $2,468 | $45,710 | $5,530 | $40,180 |
| 2016 | $2,436 | $130,600 | $15,800 | $114,800 |
| 2015 | $2,421 | $130,600 | $15,800 | $114,800 |
| 2014 | $2,118 | $43,510 | $5,250 | $38,260 |
| 2013 | $2,118 | $43,510 | $5,250 | $38,260 |
Source: Public Records
Map
Nearby Homes
- 853 S Lallendorf Rd
- 1102 Heritage Ln
- 1126 Heritage Ln
- 3860 Navarre Ave
- 3736 Navarre Ave
- 3904 Oakfield Dr
- 1450 S Lallendorf Rd
- 529 Haley Dr
- 459 Haley Dr
- 203 Eastwood Ave
- 3517 Bayberry Place Unit 3517
- 5026 Easton Dr
- 5021 Easton Dr
- 5032 Easton Dr
- 5025 Easton Dr
- 5029 Easton Dr
- 5036 Easton Dr
- 5033 Easton Dr
- 5040 Easton Dr
- 5037 Easton Dr
- 4332 Townhouse Dr Unit F
- 4330 Townhouse Dr Unit E
- 4318 Townhouse Dr Unit A
- 4322 Townhouse Dr
- 4328 Townhouse Dr Unit D
- 4310 Townhouse Dr Unit E
- 4308 Townhouse Dr Unit B
- 4308 Townhouse Dr Unit D
- 4308 Townhouse Dr
- 908 Mallard Dr
- 4312 Townhouse Dr Unit F
- 4311 Morning Dove Dr
- 918 Mallard Dr
- 4264 Townhouse Dr Unit C
- 4262 Townhouse Dr
- 4260 Townhouse Dr Unit A
- 4262 Townhouse Dr Unit B
- 4319 Townhouse Dr
- 4333 Townhouse Dr Unit G
- 4331 Townhouse Dr Unit F