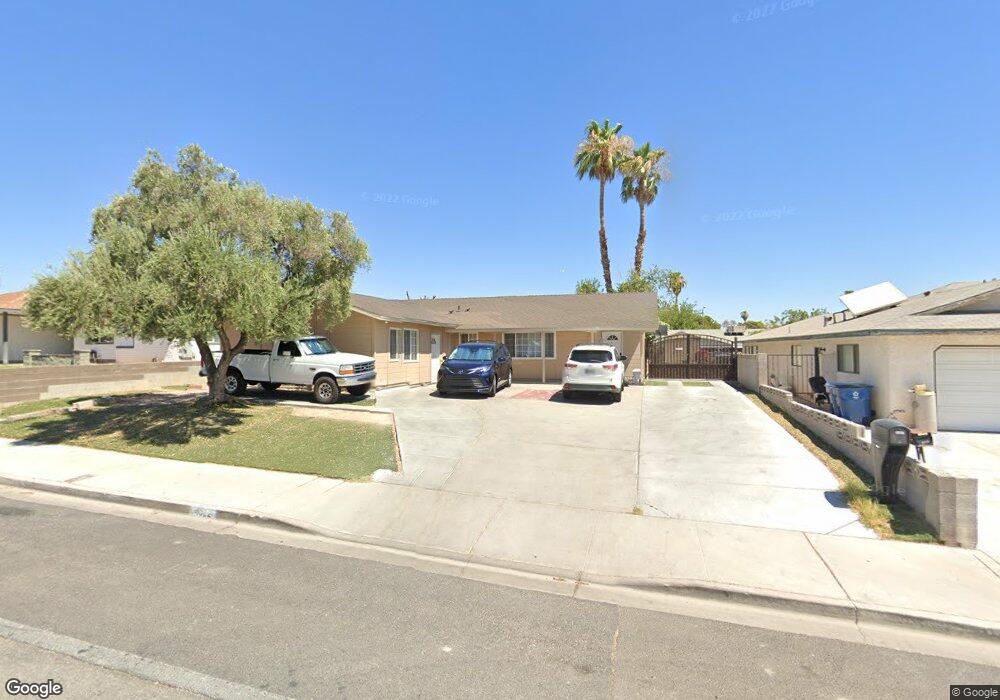
4322 E Harmon Ave Las Vegas, NV 89121
Paradise Valley East NeighborhoodEstimated Value: $415,946 - $468,000
3
Beds
2
Baths
1,877
Sq Ft
$231/Sq Ft
Est. Value
About This Home
This home is located at 4322 E Harmon Ave, Las Vegas, NV 89121 and is currently estimated at $433,237, approximately $230 per square foot. 4322 E Harmon Ave is a home located in Clark County with nearby schools including William E. Ferron Elementary School, C.W. Woodbury Middle School, and Chaparral High School.
Ownership History
Date
Name
Owned For
Owner Type
Purchase Details
Closed on
Aug 28, 2006
Sold by
Torres Jose L
Bought by
Hernandez Ana Bertha
Current Estimated Value
Purchase Details
Closed on
Oct 12, 2005
Sold by
Torres Jose L and Gonzalez Cecilia
Bought by
Torres Jose L
Purchase Details
Closed on
Sep 11, 2003
Sold by
Mckay Jeffrey Alan and Mckay Mary H
Bought by
Torres Jose L and Gonzalez Cecilia
Home Financials for this Owner
Home Financials are based on the most recent Mortgage that was taken out on this home.
Original Mortgage
$167,373
Interest Rate
5.72%
Mortgage Type
FHA
Purchase Details
Closed on
Oct 21, 1993
Sold by
Perry Alan Frank and Perry Patricia Diane
Bought by
Mckay Jeffrey Alan and Mckay Mary H
Home Financials for this Owner
Home Financials are based on the most recent Mortgage that was taken out on this home.
Original Mortgage
$89,610
Interest Rate
7.09%
Mortgage Type
VA
Create a Home Valuation Report for This Property
The Home Valuation Report is an in-depth analysis detailing your home's value as well as a comparison with similar homes in the area
Home Values in the Area
Average Home Value in this Area
Purchase History
| Date | Buyer | Sale Price | Title Company |
|---|---|---|---|
| Hernandez Ana Bertha | -- | None Available | |
| Torres Jose L | -- | Fidelity National Title | |
| Torres Jose L | -- | Fidelity National Title | |
| Torres Jose L | $170,000 | United Title Of Nevada | |
| Mckay Jeffrey Alan | $103,500 | Old Republic Title Company |
Source: Public Records
Mortgage History
| Date | Status | Borrower | Loan Amount |
|---|---|---|---|
| Previous Owner | Torres Jose L | $167,373 | |
| Previous Owner | Mckay Jeffrey Alan | $89,610 | |
| Closed | Mckay Jeffrey Alan | $16,500 |
Source: Public Records
Tax History
| Year | Tax Paid | Tax Assessment Tax Assessment Total Assessment is a certain percentage of the fair market value that is determined by local assessors to be the total taxable value of land and additions on the property. | Land | Improvement |
|---|---|---|---|---|
| 2026 | $1,324 | $62,032 | $31,850 | $30,182 |
| 2025 | $1,131 | $61,557 | $31,150 | $30,407 |
| 2024 | $1,413 | $61,557 | $31,150 | $30,407 |
| 2023 | $1,413 | $65,623 | $36,750 | $28,873 |
| 2022 | $1,373 | $58,966 | $31,500 | $27,466 |
| 2021 | $1,372 | $52,673 | $25,900 | $26,773 |
| 2020 | $1,003 | $52,548 | $25,200 | $27,348 |
| 2019 | $940 | $50,822 | $23,100 | $27,722 |
| 2018 | $897 | $48,940 | $21,700 | $27,240 |
| 2017 | $1,363 | $46,465 | $18,200 | $28,265 |
| 2016 | $1,115 | $41,750 | $12,250 | $29,500 |
| 2015 | $1,112 | $39,354 | $10,500 | $28,854 |
| 2014 | $1,086 | $34,515 | $6,300 | $28,215 |
Source: Public Records
Map
Nearby Homes
- 4278 El Campana Way
- 4468 El Pito Ln
- 4455 Powell Ave
- 4341 Seville St
- 4422 El Como Way
- 4444 El Como Way
- 4518 El Canela Way
- 4454 Dennis Way
- 4092 E Harmon Ave
- 4492 E Rochelle Ave
- 4681 Lancer Way
- 4429 Rimcrest Rd
- 4606 Powell Ave
- 4630 Gabriel Dr
- 4625 La Fonda Dr
- 3955 Ventura Way
- 4277 Rimcrest Rd
- 4231 Rimcrest Rd
- 4072 Great Plains Way
- 4063 Gold Coast Dr
- 4310 E Harmon Ave
- 4332 E Harmon Ave
- 4310 E Harmon Ave
- 4317 Powell Ave
- 4327 Powell Ave
- 4300 E Harmon Ave
- 4342 E Harmon Ave
- 4335 Powell Ave
- 4323 E Harmon Ave
- 4301 Powell Ave
- 4311 E Harmon Ave
- 4333 E Harmon Ave
- 4345 Powell Ave
- 4290 E Harmon Ave
- 4301 E Harmon Ave
- 4343 E Harmon Ave
- 4324 Powell Ave
- 4316 Powell Ave
- 4334 Powell Ave
Your Personal Tour Guide
Ask me questions while you tour the home.