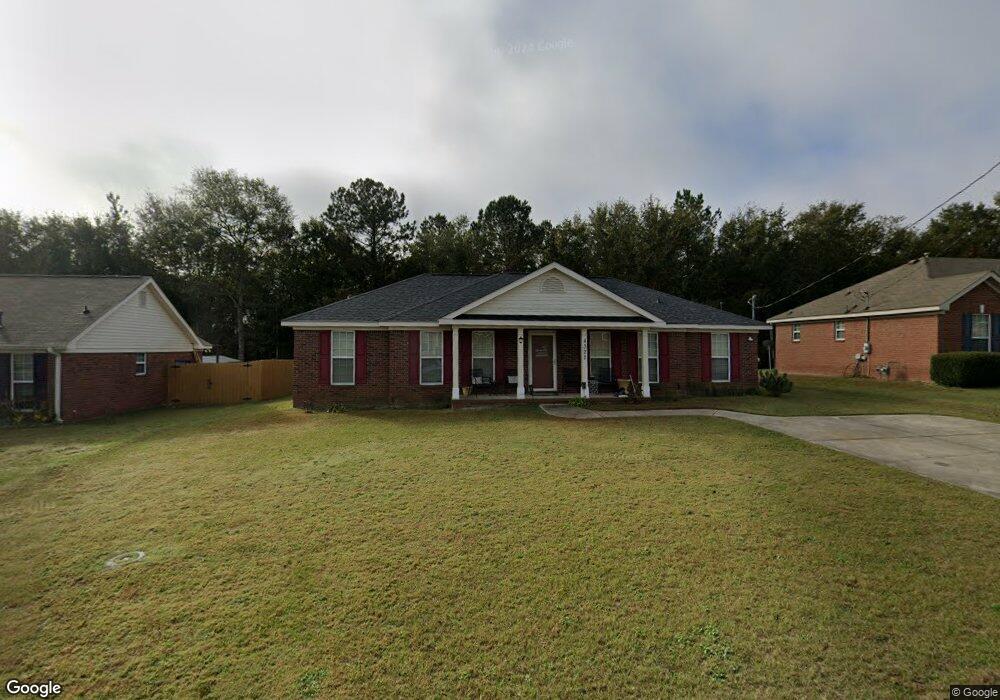
4322 Sanderling Dr Augusta, GA 30906
Richmond Factory NeighborhoodEstimated Value: $203,000 - $242,000
3
Beds
2
Baths
1,575
Sq Ft
$138/Sq Ft
Est. Value
About This Home
This home is located at 4322 Sanderling Dr, Augusta, GA 30906 and is currently estimated at $217,332, approximately $137 per square foot. 4322 Sanderling Dr is a home located in Richmond County with nearby schools including Diamond Lakes Elementary School, Pine Hill Middle School, and Johnson Magnet.
Ownership History
Date
Name
Owned For
Owner Type
Purchase Details
Closed on
Oct 15, 2007
Sold by
Hud
Bought by
Ware Cheryl
Current Estimated Value
Home Financials for this Owner
Home Financials are based on the most recent Mortgage that was taken out on this home.
Original Mortgage
$100,916
Outstanding Balance
$62,581
Interest Rate
6.44%
Mortgage Type
FHA
Estimated Equity
$154,751
Purchase Details
Closed on
Feb 6, 2007
Sold by
Bentley Jeffrey T
Bought by
Wells Fargo Bank N A
Purchase Details
Closed on
Mar 2, 2005
Sold by
Nordahl Homes Inc
Bought by
Bentley Jeffrey T and Bentley Yvette
Home Financials for this Owner
Home Financials are based on the most recent Mortgage that was taken out on this home.
Original Mortgage
$112,041
Interest Rate
5.61%
Mortgage Type
FHA
Purchase Details
Closed on
Jun 22, 2004
Sold by
Price Charles Preston
Bought by
Nordahl Homes Inc
Create a Home Valuation Report for This Property
The Home Valuation Report is an in-depth analysis detailing your home's value as well as a comparison with similar homes in the area
Home Values in the Area
Average Home Value in this Area
Purchase History
| Date | Buyer | Sale Price | Title Company |
|---|---|---|---|
| Ware Cheryl | -- | None Available | |
| Ware Cheryl | $102,500 | -- | |
| Wells Fargo Bank N A | -- | -- | |
| Bentley Jeffrey T | $113,800 | -- | |
| Nordahl Homes Inc | $15,900 | -- |
Source: Public Records
Mortgage History
| Date | Status | Borrower | Loan Amount |
|---|---|---|---|
| Open | Ware Cheryl | $100,916 | |
| Previous Owner | Bentley Jeffrey T | $112,041 |
Source: Public Records
Tax History
| Year | Tax Paid | Tax Assessment Tax Assessment Total Assessment is a certain percentage of the fair market value that is determined by local assessors to be the total taxable value of land and additions on the property. | Land | Improvement |
|---|---|---|---|---|
| 2025 | $2,543 | $82,144 | $6,360 | $75,784 |
| 2024 | $2,543 | $82,216 | $6,360 | $75,856 |
| 2023 | $1,704 | $74,692 | $6,360 | $68,332 |
| 2022 | $2,025 | $63,170 | $6,360 | $56,810 |
| 2021 | $1,634 | $45,310 | $6,360 | $38,950 |
| 2020 | $1,611 | $45,310 | $6,360 | $38,950 |
| 2019 | $1,700 | $45,310 | $6,360 | $38,950 |
| 2018 | $1,709 | $45,272 | $6,360 | $38,912 |
| 2017 | $1,662 | $45,272 | $6,360 | $38,912 |
| 2016 | $1,663 | $45,272 | $6,360 | $38,912 |
| 2015 | $1,674 | $45,272 | $6,360 | $38,912 |
| 2014 | $1,668 | $45,044 | $6,360 | $38,684 |
Source: Public Records
Map
Nearby Homes
- 2264 Basswood Dr
- 2348 Fieldcrest Rd
- 2383 Richwood Dr
- 4211 Stone Rd
- 4213 Stone Rd
- 2219 Travis Rd
- 4304 Parkwood Dr
- 2264 Nellie Dr
- 4305 Parkwood Dr
- 4332 Parkwood Dr
- 2104 Travis Rd
- 304 Suncrest Ct
- 307 Suncrest Ct
- 308 Suncrest Ct
- 323 Suncrest Ct
- 328 Suncrest Ct
- 2323 Woodsman Dr
- 2357 Basswood Dr
- 2382 Patrick Ave
- 2369a Plantation Rd
- 4324 Sanderling Dr
- 4320 Sanderling Dr
- 4326 Sanderling Dr
- 4318 Sanderling Dr
- 4319 Sanderling Dr
- 4317 Sanderling Dr
- 4321 Sanderling Dr
- 4602 Manteo Ct
- 4328 Sanderling Dr
- 4316 Sanderling Dr
- 4501 Curriluck Ct
- 4604 Manteo Ct
- 4330 Sanderling Dr
- 4506 Manteo Ct
- 4601 Manteo Ct
- 4505 Curriluck Ct
- 2261 Basswood Dr
- 2265 Basswood Dr
- 2259 Basswood Dr
- 4332 Sanderling Dr
Your Personal Tour Guide
Ask me questions while you tour the home.