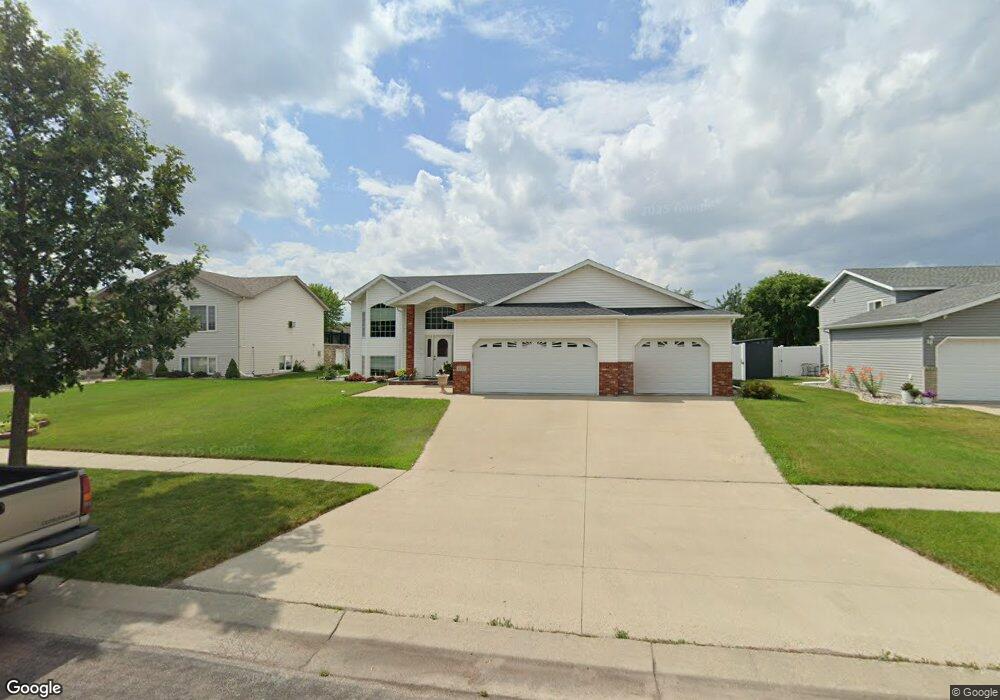
4323 54th St S Fargo, ND 58104
Osgood NeighborhoodEstimated Value: $428,000 - $496,000
4
Beds
3
Baths
2,780
Sq Ft
$162/Sq Ft
Est. Value
About This Home
This home is located at 4323 54th St S, Fargo, ND 58104 and is currently estimated at $450,231, approximately $161 per square foot. 4323 54th St S is a home located in Cass County with nearby schools including Osgood Elementary School, Liberty Middle School, and West Fargo Sheyenne High School.
Ownership History
Date
Name
Owned For
Owner Type
Purchase Details
Closed on
Sep 7, 2022
Sold by
Schell Dwayne A and Schell Teresia E
Bought by
Schell Dwayne A and Schell Teresia E
Current Estimated Value
Purchase Details
Closed on
Nov 10, 2010
Sold by
Steinmetz Matthew W and Steinmetz Deann M
Bought by
Schell Dwayne and Schell Teresia
Home Financials for this Owner
Home Financials are based on the most recent Mortgage that was taken out on this home.
Original Mortgage
$216,000
Interest Rate
4.31%
Mortgage Type
New Conventional
Purchase Details
Closed on
Dec 20, 2007
Sold by
Brad Paul Enterprises Inc
Bought by
Steinmetz Matthew W and Steinmetz Deann M
Home Financials for this Owner
Home Financials are based on the most recent Mortgage that was taken out on this home.
Original Mortgage
$209,600
Interest Rate
6.31%
Mortgage Type
New Conventional
Create a Home Valuation Report for This Property
The Home Valuation Report is an in-depth analysis detailing your home's value as well as a comparison with similar homes in the area
Home Values in the Area
Average Home Value in this Area
Purchase History
| Date | Buyer | Sale Price | Title Company |
|---|---|---|---|
| Schell Dwayne A | -- | None Listed On Document | |
| Schell Dwayne | -- | -- | |
| Steinmetz Matthew W | -- | -- |
Source: Public Records
Mortgage History
| Date | Status | Borrower | Loan Amount |
|---|---|---|---|
| Previous Owner | Schell Dwayne A | $178,000 | |
| Previous Owner | Schell Dwayne | $216,000 | |
| Previous Owner | Steinmetz Matthew W | $209,600 | |
| Previous Owner | Brad Paul Enterprises Inc | $192,000 |
Source: Public Records
Tax History Compared to Growth
Tax History
| Year | Tax Paid | Tax Assessment Tax Assessment Total Assessment is a certain percentage of the fair market value that is determined by local assessors to be the total taxable value of land and additions on the property. | Land | Improvement |
|---|---|---|---|---|
| 2024 | $4,355 | $196,000 | $36,600 | $159,400 |
| 2023 | $4,628 | $188,700 | $38,500 | $150,200 |
| 2022 | $4,513 | $176,350 | $38,500 | $137,850 |
| 2021 | $4,054 | $156,750 | $38,500 | $118,250 |
| 2020 | $3,862 | $152,200 | $38,500 | $113,700 |
| 2019 | $3,837 | $152,200 | $24,050 | $128,150 |
| 2018 | $3,731 | $152,200 | $24,050 | $128,150 |
| 2017 | $3,575 | $149,750 | $24,050 | $125,700 |
| 2016 | $4,948 | $136,150 | $24,050 | $112,100 |
| 2015 | $5,036 | $136,150 | $16,350 | $119,800 |
| 2014 | $4,659 | $115,150 | $16,350 | $98,800 |
| 2013 | $4,627 | $107,600 | $16,350 | $91,250 |
Source: Public Records
Map
Nearby Homes
- 4315 53rd St S
- 5527 Tuscan Ct S
- 5555 Tuscan Ct S
- 4267 51st St S
- 4272 51st St S
- 4285 Estate Dr S
- 9350 & 9124 57th St S
- 4304 Estate Dr S
- 4110 52nd St S
- 5269 Veterans Blvd
- 5261 Veterans Blvd
- 4418 50th St S
- 5256 48th Ave S
- 4734 51st St S
- 5445 Justice Dr S
- 5277 49th Ave S
- 4733 Clock Tower Ln S
- 4450 48th St S