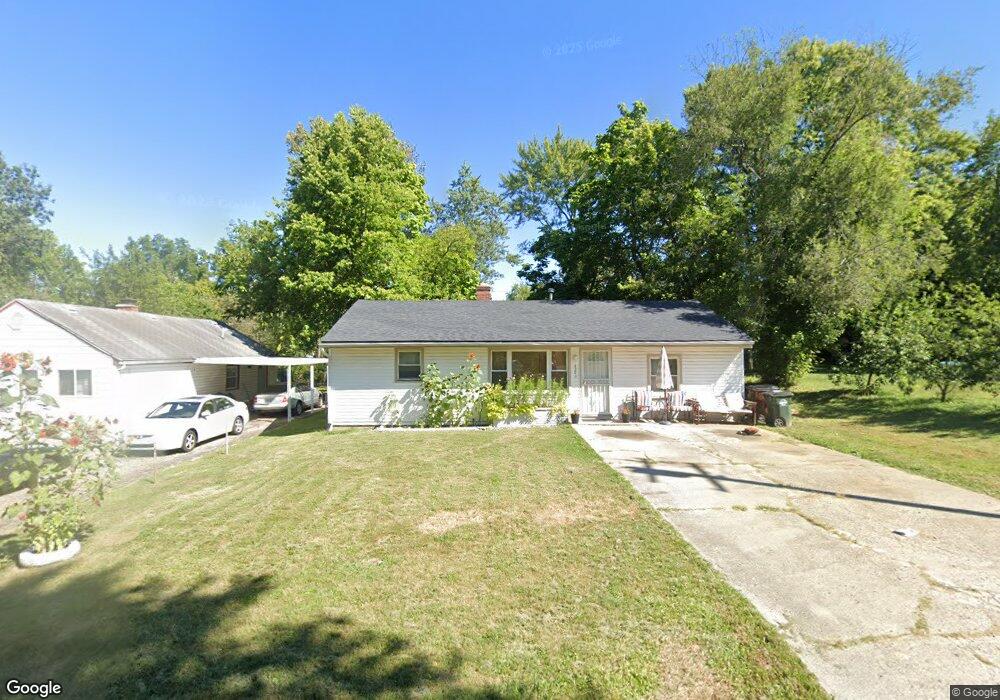
4323 Annapolis Ave Dayton, OH 45416
Estimated Value: $82,000 - $109,000
2
Beds
1
Bath
1,008
Sq Ft
$94/Sq Ft
Est. Value
About This Home
This home is located at 4323 Annapolis Ave, Dayton, OH 45416 and is currently estimated at $94,299, approximately $93 per square foot. 4323 Annapolis Ave is a home located in Montgomery County with nearby schools including Valerie Elementary School, Imagine Klepinger Road Community School, and North Dayton School of Science & Discovery.
Ownership History
Date
Name
Owned For
Owner Type
Purchase Details
Closed on
Feb 28, 2025
Sold by
First National Acceptance Company
Bought by
Blackstar Stability Revitalization Trust
Current Estimated Value
Purchase Details
Closed on
Sep 15, 2001
Sold by
Young Linda A
Bought by
Croft Yvonne A
Home Financials for this Owner
Home Financials are based on the most recent Mortgage that was taken out on this home.
Original Mortgage
$40,000
Interest Rate
10.5%
Mortgage Type
Seller Take Back
Purchase Details
Closed on
Sep 30, 1999
Sold by
Miller Felicia Nicole
Bought by
Young Linda A
Purchase Details
Closed on
Aug 11, 1999
Sold by
Ann Lang Ruth and Lang Ruth
Bought by
Miller Felicia Nicole
Purchase Details
Closed on
Aug 23, 1993
Sold by
Lang Earl J and Lang Earl
Bought by
Lang Ruth Ann and Lang Ruth
Create a Home Valuation Report for This Property
The Home Valuation Report is an in-depth analysis detailing your home's value as well as a comparison with similar homes in the area
Home Values in the Area
Average Home Value in this Area
Purchase History
| Date | Buyer | Sale Price | Title Company |
|---|---|---|---|
| Blackstar Stability Revitalization Trust | -- | Servicelink | |
| Croft Yvonne A | $41,500 | -- | |
| Young Linda A | $29,900 | -- | |
| Miller Felicia Nicole | $29,900 | -- | |
| Lang Ruth Ann | -- | -- |
Source: Public Records
Mortgage History
| Date | Status | Borrower | Loan Amount |
|---|---|---|---|
| Previous Owner | Croft Yvonne A | $40,000 |
Source: Public Records
Tax History Compared to Growth
Tax History
| Year | Tax Paid | Tax Assessment Tax Assessment Total Assessment is a certain percentage of the fair market value that is determined by local assessors to be the total taxable value of land and additions on the property. | Land | Improvement |
|---|---|---|---|---|
| 2024 | $779 | $12,270 | $3,490 | $8,780 |
| 2023 | $779 | $12,270 | $3,490 | $8,780 |
| 2022 | $885 | $10,370 | $2,950 | $7,420 |
| 2021 | $881 | $10,370 | $2,950 | $7,420 |
| 2020 | $878 | $10,370 | $2,950 | $7,420 |
| 2019 | $930 | $9,830 | $2,950 | $6,880 |
| 2018 | $931 | $9,830 | $2,950 | $6,880 |
| 2017 | $924 | $9,830 | $2,950 | $6,880 |
| 2016 | $966 | $9,830 | $2,950 | $6,880 |
| 2015 | $921 | $9,830 | $2,950 | $6,880 |
| 2014 | $921 | $9,830 | $2,950 | $6,880 |
| 2012 | -- | $14,160 | $3,930 | $10,230 |
Source: Public Records
Map
Nearby Homes
- 4322 Annapolis Ave
- 4237 Nevada Ave
- 4472 Curundu Ave
- 4180 Indian Ln
- 4104 Brenton Dr
- 4703 Natchez Ave
- 4235 Merryfield Ave
- 4131 Merryfield Ave
- 4616 Channing Ln
- 3462 Arlene Ave
- 4228 Molane St
- 3709 Mandalay Dr
- 4831 Free Pike
- LOT#26 Glenbrook Dr
- Lot#1 Glenbrook Dr
- Lot#24 Glenbrook Dr
- Lot#21 Glenbrook Dr
- 3713 El Paso Ave
- Lot#14 Bridgeport Dr
- Lot#15 Bridgeport Dr
- 4319 Annapolis Ave
- 4327 Annapolis Ave
- 4311 Annapolis Ave
- 4318 Natchez Ave
- 4324 Annapolis Ave
- 4314 Natchez Ave
- 4320 Natchez Ave
- 4339 Annapolis Ave
- 4318 Annapolis Ave
- 4305 Annapolis Ave
- 4332 Annapolis Ave
- 4308 Annapolis Ave
- 1055 Annapolis Ave
- 4300 Natchez Ave
- 4302 Annapolis Ave
- 4346 Natchez Ave
- 4156 Annapolis Ave
- 4153 Annapolis Ave
- 4342 Annapolis Ave
- 4317 Natchez Ave