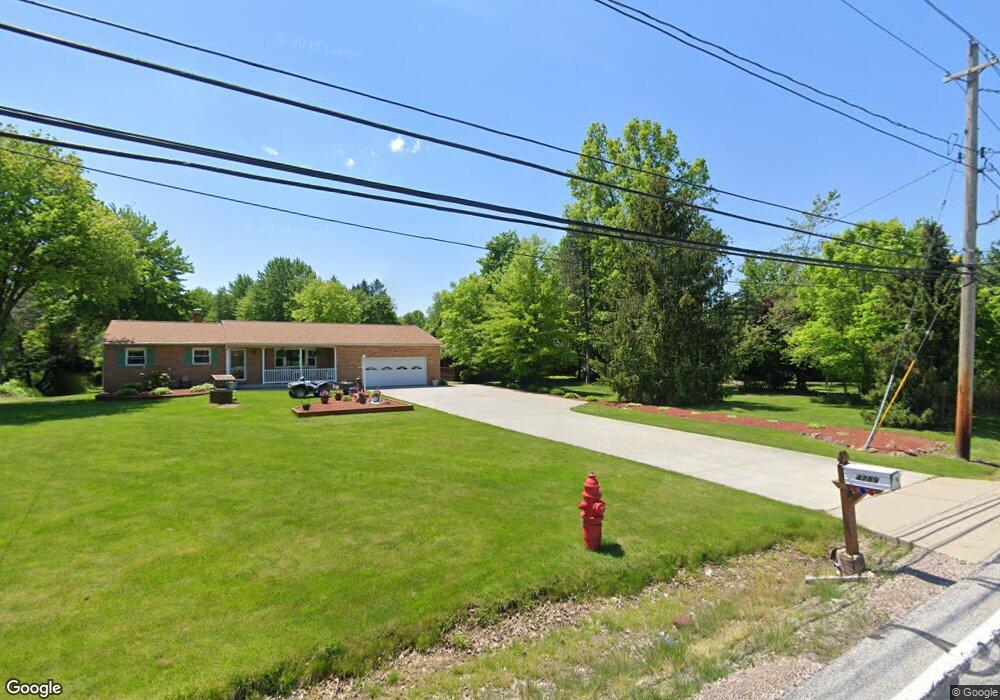
4323 Edgerton Rd North Royalton, OH 44133
Estimated Value: $387,000 - $469,000
4
Beds
3
Baths
2,352
Sq Ft
$186/Sq Ft
Est. Value
About This Home
This home is located at 4323 Edgerton Rd, North Royalton, OH 44133 and is currently estimated at $437,642, approximately $186 per square foot. 4323 Edgerton Rd is a home located in Cuyahoga County with nearby schools including North Royalton Middle School, North Royalton High School, and Assumption Academy.
Ownership History
Date
Name
Owned For
Owner Type
Purchase Details
Closed on
Sep 29, 2005
Sold by
Vana Anthony M and Vana Marlene
Bought by
Iglai Christopher A and Iglai Ann M
Current Estimated Value
Home Financials for this Owner
Home Financials are based on the most recent Mortgage that was taken out on this home.
Original Mortgage
$205,600
Outstanding Balance
$111,223
Interest Rate
5.93%
Mortgage Type
Fannie Mae Freddie Mac
Estimated Equity
$326,419
Purchase Details
Closed on
Aug 4, 2003
Sold by
Vana Anthony M and Vana Marlene
Bought by
Vana Anthony M and Vana Marlene
Purchase Details
Closed on
Oct 7, 1987
Sold by
Vlk Vincent E and Vlk Margaret
Bought by
Vana Anthony M
Purchase Details
Closed on
Aug 9, 1982
Sold by
Vlk Vincent E and Vlk Margaret
Bought by
Vlk Vincent E and Vlk Margaret
Purchase Details
Closed on
Jan 1, 1975
Bought by
Vlk Vincent E and Vlk Margaret
Create a Home Valuation Report for This Property
The Home Valuation Report is an in-depth analysis detailing your home's value as well as a comparison with similar homes in the area
Home Values in the Area
Average Home Value in this Area
Purchase History
| Date | Buyer | Sale Price | Title Company |
|---|---|---|---|
| Iglai Christopher A | $257,700 | Enterprise Title Agency | |
| Vana Anthony M | -- | -- | |
| Vana Anthony M | $30,000 | -- | |
| Vlk Vincent E | -- | -- | |
| Vlk Vincent E | -- | -- |
Source: Public Records
Mortgage History
| Date | Status | Borrower | Loan Amount |
|---|---|---|---|
| Open | Iglai Christopher A | $205,600 |
Source: Public Records
Tax History Compared to Growth
Tax History
| Year | Tax Paid | Tax Assessment Tax Assessment Total Assessment is a certain percentage of the fair market value that is determined by local assessors to be the total taxable value of land and additions on the property. | Land | Improvement |
|---|---|---|---|---|
| 2024 | $7,534 | $129,115 | $39,655 | $89,460 |
| 2023 | $7,199 | $113,270 | $28,040 | $85,230 |
| 2022 | $7,151 | $113,260 | $28,040 | $85,230 |
| 2021 | $7,227 | $113,260 | $28,040 | $85,230 |
| 2020 | $6,389 | $95,170 | $23,560 | $71,610 |
| 2019 | $6,203 | $271,900 | $67,300 | $204,600 |
| 2018 | $5,766 | $95,170 | $23,560 | $71,610 |
| 2017 | $5,615 | $81,560 | $10,400 | $71,160 |
| 2016 | $5,263 | $81,560 | $10,400 | $71,160 |
| 2015 | $4,821 | $81,560 | $10,400 | $71,160 |
| 2014 | $4,821 | $74,130 | $9,450 | $64,680 |
Source: Public Records
Map
Nearby Homes
- 0 Valley Pkwy Unit 5118483
- 16577 State Rd
- 5469 Riverview Dr
- 9790 Hidden Hollow Trail
- BUCHANAN Plan at Pine Hill
- HALEY Plan at Pine Hill
- CHAMP Plan at Pine Hill
- VANDERBURGH Plan at Pine Hill
- BELLEVILLE Plan at Pine Hill
- SEBASTIAN Plan at Pine Hill
- NORTHWOOD Plan at Pine Hill
- LYNDHURST Plan at Pine Hill
- BEDFORD Plan at Pine Hill
- CRESTWOOD Plan at Pine Hill
- BRENNAN Plan at Pine Hill
- VIOLA Plan at Pine Hill
- 4354 Brookhaven Dr
- 18676 Glenbrook
- 18591 Glenbrook
- 4428 Akins Rd
- 4289 Edgerton Rd
- 4153 Edgerton Rd
- 4429 Edgerton Rd
- 4133 Edgerton Rd
- 4435 Edgerton Rd
- 4300 Edgerton Rd
- 4250 Edgerton Rd
- 4423 Edgerton Rd
- 4214 Edgerton Rd
- 4121 Edgerton Rd
- 4364 Edgerton Rd
- 4459 Edgerton Rd
- 4352 Edgerton Rd
- 4168 Edgerton Rd
- 4471 Edgerton Rd
- 4022 Edgerton Rd
- 4448 Edgerton Rd
- 4010 Edgerton Rd
- 4027 Edgerton Rd
- 4546 Edgerton Rd