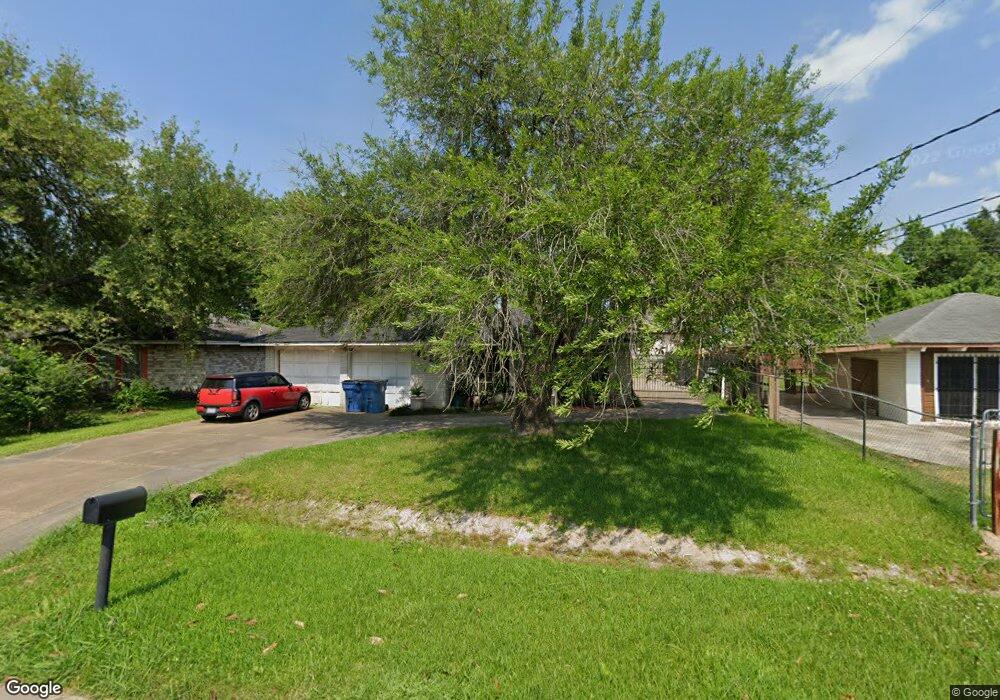
4323 Foxhill St Houston, TX 77093
East Aldine NeighborhoodEstimated Value: $180,131 - $196,000
3
Beds
2
Baths
805
Sq Ft
$234/Sq Ft
Est. Value
About This Home
This home is located at 4323 Foxhill St, Houston, TX 77093 and is currently estimated at $188,533, approximately $234 per square foot. 4323 Foxhill St is a home located in Harris County with nearby schools including Vardeman EC/PK/K, Orange Grove Elementary School, and Macarthur Ninth Grade School.
Ownership History
Date
Name
Owned For
Owner Type
Purchase Details
Closed on
Feb 11, 2003
Sold by
Firstexas Residential Corp
Bought by
Villarreal Juan Luis
Current Estimated Value
Home Financials for this Owner
Home Financials are based on the most recent Mortgage that was taken out on this home.
Original Mortgage
$75,500
Outstanding Balance
$32,075
Interest Rate
5.84%
Estimated Equity
$156,458
Purchase Details
Closed on
Nov 22, 2002
Sold by
Rowe Morgan W and Rowe Nancy A
Bought by
Firstexas Residential Corp
Home Financials for this Owner
Home Financials are based on the most recent Mortgage that was taken out on this home.
Original Mortgage
$31,000
Interest Rate
6.28%
Mortgage Type
Purchase Money Mortgage
Purchase Details
Closed on
Mar 2, 2000
Sold by
Rowe Morgan T and Rowe Patsy M
Bought by
Rowe Morgan W and Rowe Nancy A
Create a Home Valuation Report for This Property
The Home Valuation Report is an in-depth analysis detailing your home's value as well as a comparison with similar homes in the area
Home Values in the Area
Average Home Value in this Area
Purchase History
| Date | Buyer | Sale Price | Title Company |
|---|---|---|---|
| Villarreal Juan Luis | -- | Commonwealth Land Title Co | |
| Firstexas Residential Corp | -- | Commonwealth Land Title Co | |
| Rowe Morgan W | -- | -- |
Source: Public Records
Mortgage History
| Date | Status | Borrower | Loan Amount |
|---|---|---|---|
| Open | Villarreal Juan Luis | $75,500 | |
| Previous Owner | Firstexas Residential Corp | $31,000 |
Source: Public Records
Tax History Compared to Growth
Tax History
| Year | Tax Paid | Tax Assessment Tax Assessment Total Assessment is a certain percentage of the fair market value that is determined by local assessors to be the total taxable value of land and additions on the property. | Land | Improvement |
|---|---|---|---|---|
| 2025 | $1,433 | $158,908 | $34,050 | $124,858 |
| 2024 | $1,433 | $172,046 | $34,050 | $137,996 |
| 2023 | $1,433 | $157,577 | $34,050 | $123,527 |
| 2022 | $2,323 | $113,676 | $11,577 | $102,099 |
| 2021 | $2,214 | $102,726 | $11,577 | $91,149 |
| 2020 | $2,334 | $102,726 | $11,577 | $91,149 |
| 2019 | $2,263 | $95,124 | $11,577 | $83,547 |
| 2018 | $1,015 | $95,656 | $11,577 | $84,079 |
| 2017 | $2,168 | $95,656 | $11,577 | $84,079 |
| 2016 | $2,168 | $95,656 | $11,577 | $84,079 |
| 2015 | $1,488 | $93,629 | $11,577 | $82,052 |
| 2014 | $1,488 | $80,202 | $11,577 | $68,625 |
Source: Public Records
Map
Nearby Homes
- 9213 Washington St
- 4522 Collins Rd
- 4007 Wedgewood St
- 4415 Mooney Rd
- 11769 Gloger St
- 11206 Eastex Fwy
- 11781 Eastex Fwy
- 11937 Connor St
- 3418 Hopper Rd
- 11375 Allwood St
- 2930 Bertrand St
- 3111 Hartwick Rd
- 3214 Brea Crest St
- 2922 Bertrand St
- 4410 Shelton Rd
- 3804 Cedar Hill Ln
- 4803 Bethany Ln
- 5404 Mount Houston Rd
- 2915 Brea Crest St
- 4801 Marquita Ln
- 4327 Foxhill St
- 4319 Foxhill St
- 4404 Mierianne St
- 4331 Foxhill St
- 4306 Foxhill St
- 4406 Mierianne St
- 4315 Foxhill St
- 4409 Charwon St
- 4307 Oakville St
- 4311 Foxhill St
- 4335 Foxhill St
- 4302 Foxhill St
- 4402 Gaston St
- 4303 Oakville St
- 4307 Foxhill St
- 4417 Charwon St
- 0 Charwon - Unit 2 Street 36236777
- 0 Charwon - Unit 4 Street 35924129
- 0 Charwon - Unit 3 Street 3275033
- 0 Charwon - Unit 2 Street