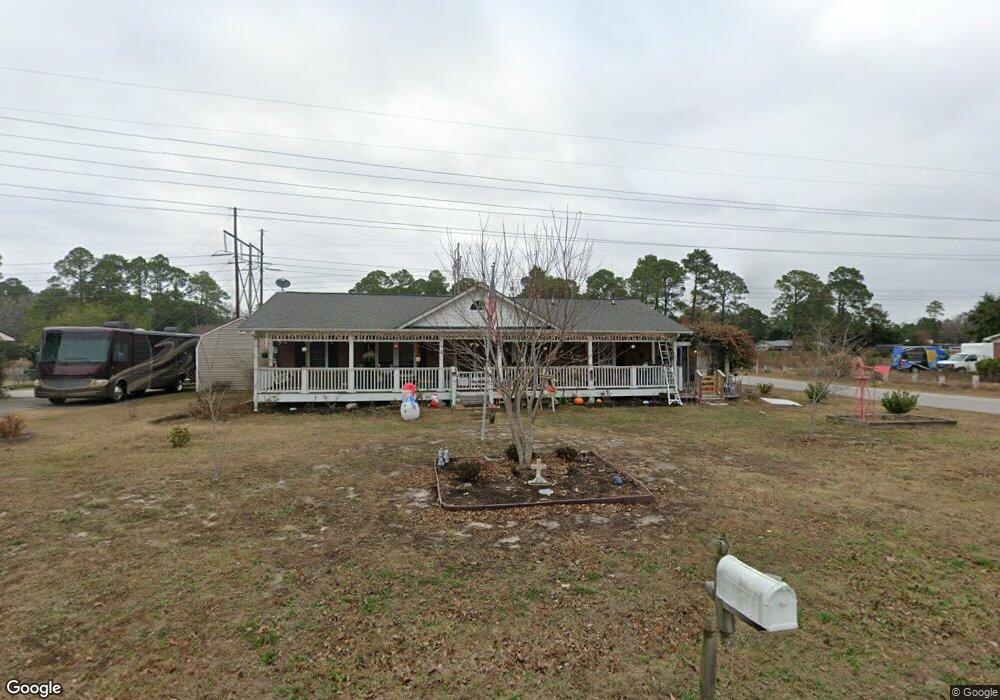
4324 Pine Ln Unit Peachtree Estates Myrtle Beach, SC 29588
Estimated Value: $266,583 - $289,000
3
Beds
2
Baths
1,525
Sq Ft
$183/Sq Ft
Est. Value
About This Home
This home is located at 4324 Pine Ln Unit Peachtree Estates, Myrtle Beach, SC 29588 and is currently estimated at $278,396, approximately $182 per square foot. 4324 Pine Ln Unit Peachtree Estates is a home located in Horry County with nearby schools including Palmetto Bays Elementary School, Black Water Middle School, and Carolina Forest High School.
Ownership History
Date
Name
Owned For
Owner Type
Purchase Details
Closed on
Apr 17, 2018
Sold by
Brown George Ashley
Bought by
Burge Claudia Constance
Current Estimated Value
Home Financials for this Owner
Home Financials are based on the most recent Mortgage that was taken out on this home.
Original Mortgage
$164,000
Outstanding Balance
$141,070
Interest Rate
4.45%
Mortgage Type
VA
Estimated Equity
$137,326
Purchase Details
Closed on
Jun 20, 2014
Sold by
Hanna Gubicza Kathleen J
Bought by
Haselden Brown George Ashley and Haselden Brown Deborah
Purchase Details
Closed on
Aug 23, 1999
Sold by
Johnston Cindy Tarlton and Johnston James
Bought by
Hanna Gubicza Kathleen J
Home Financials for this Owner
Home Financials are based on the most recent Mortgage that was taken out on this home.
Original Mortgage
$77,362
Interest Rate
7.5%
Mortgage Type
FHA
Create a Home Valuation Report for This Property
The Home Valuation Report is an in-depth analysis detailing your home's value as well as a comparison with similar homes in the area
Home Values in the Area
Average Home Value in this Area
Purchase History
| Date | Buyer | Sale Price | Title Company |
|---|---|---|---|
| Burge Claudia Constance | $164,000 | -- | |
| Haselden Brown George Ashley | $134,000 | -- | |
| Hanna Gubicza Kathleen J | $78,000 | -- |
Source: Public Records
Mortgage History
| Date | Status | Borrower | Loan Amount |
|---|---|---|---|
| Open | Burge Claudia Constance | $164,000 | |
| Previous Owner | Hanna Gubicza Kathleen J | $77,362 |
Source: Public Records
Tax History Compared to Growth
Tax History
| Year | Tax Paid | Tax Assessment Tax Assessment Total Assessment is a certain percentage of the fair market value that is determined by local assessors to be the total taxable value of land and additions on the property. | Land | Improvement |
|---|---|---|---|---|
| 2024 | $704 | $11,470 | $2,720 | $8,750 |
| 2023 | $704 | $7,560 | $1,068 | $6,492 |
| 2021 | $615 | $7,560 | $1,068 | $6,492 |
| 2020 | $528 | $7,560 | $1,068 | $6,492 |
| 2019 | $469 | $6,876 | $1,068 | $5,808 |
| 2018 | $513 | $5,234 | $966 | $4,268 |
| 2017 | $319 | $5,234 | $966 | $4,268 |
| 2016 | -- | $5,234 | $966 | $4,268 |
| 2015 | $325 | $5,234 | $966 | $4,268 |
| 2014 | $427 | $4,718 | $966 | $3,752 |
Source: Public Records
Map
Nearby Homes
- 4314 Pine Ln
- 4215 Peachtree Ln
- 4205 Peachtree Ln
- 244 Jasper Overlook Way Unit 244
- 253 Jasper Overlook Way Unit 60
- 4417 Mill Pond Rd
- 4317 Flat Bay Cir
- 7991 S Carolina 814
- 4231 Roscoe Rd
- 4261 Blake Rd
- TBD Roscoe Rd
- 125 Faust Ln
- 4842 Mill Pond Rd
- 105 Shady View Ln
- 4514 Misty Ln
- TBD Highway 544 Unit & Carolina Lakes Blv
- 8525 Highway 814
- 228 Fern Creek Ct
- 754 Falling Leaf Loop
- 457 Falling Leaf Loop Unit Wilmington 1
- 4324 Pine Ln
- 4324 Pine Ln Unit Lot 1
- 10 Pine Ln
- 4328 Pine Ln
- 4312 Pine Ln
- 4213 Peachtree Ln
- 4332 Peachtree Dr
- 4313 Pine Ln
- 4330 Pine Ln
- 4330 Peachtree Dr
- 4217 Peachtree Ln
- 5280 Peachtree Dr
- 4328 Peachtree Dr
- 4207 Peachtree Ln
- 4332 Pine Ln
- 4205 Peachtree Ln Unit Peachtree Estates
- 4219 Peachtree Ln
- 4212 Peachtree Ln
- 4326 Peachtree Dr
- 4288 Mill Pond Rd