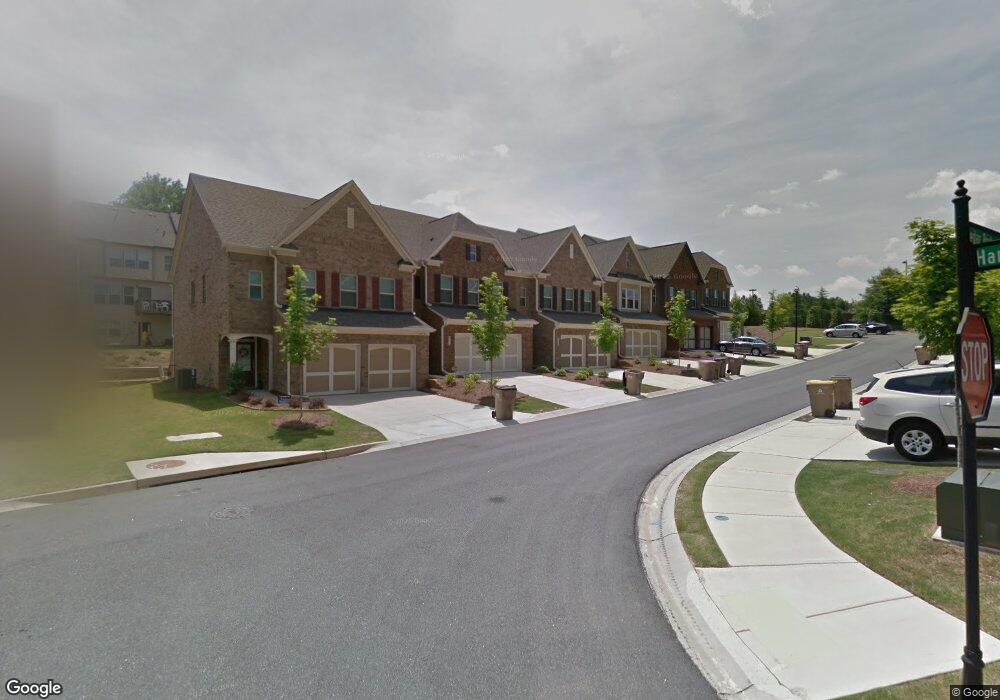
4325 Cedar Bridge Walk Suwanee, GA 30024
Estimated Value: $509,869 - $533,000
About This Home
4 Bed and 3.5 bath 3 story Town home available for rent in Lakepoint @ Johns Creek which is one of the safest city in America. Hardwood floors on Main level. Open Kitchen with Stainless steel appliances and granite counters. Master Suite with vaulted ceilings and nice sized ensuite bathroom with a huge closet and two generously sized secondary bedrooms that share a bathroom, loft area, laundry and a bedroom with attached bath on the third floor perfect for an office or media room. Top schools: Johns Creek elementary, River Watch middle, Lambert high which are all highly (10/10) ranked. Walking distance to shopping and industry park. Great access to highway 85, 141 and 400. Good commute to everywhere. Lawn maintenance included. Swimming pool with covered cabana community. Truly a wonderful place to call home!
Ownership History
Purchase Details
Home Financials for this Owner
Home Financials are based on the most recent Mortgage that was taken out on this home.Home Values in the Area
Average Home Value in this Area
Purchase History
| Date | Buyer | Sale Price | Title Company |
|---|---|---|---|
| Nagaraj Srinivas | $267,425 | -- |
Mortgage History
| Date | Status | Borrower | Loan Amount |
|---|---|---|---|
| Open | Nagaraj Srinivas | $213,940 |
Property History
| Date | Event | Price | List to Sale | Price per Sq Ft |
|---|---|---|---|---|
| 04/24/2025 04/24/25 | Off Market | $2,700 | -- | -- |
| 03/13/2025 03/13/25 | For Rent | $2,700 | -- | -- |
Tax History Compared to Growth
Tax History
| Year | Tax Paid | Tax Assessment Tax Assessment Total Assessment is a certain percentage of the fair market value that is determined by local assessors to be the total taxable value of land and additions on the property. | Land | Improvement |
|---|---|---|---|---|
| 2025 | $4,554 | $200,072 | $78,000 | $122,072 |
| 2024 | $4,554 | $185,728 | $66,000 | $119,728 |
| 2023 | $4,244 | $172,420 | $56,000 | $116,420 |
| 2022 | $3,653 | $120,500 | $40,000 | $80,500 |
| 2021 | $3,327 | $120,500 | $40,000 | $80,500 |
| 2020 | $3,424 | $123,988 | $56,000 | $67,988 |
| 2019 | $3,519 | $127,236 | $56,000 | $71,236 |
| 2018 | $3,061 | $110,684 | $32,000 | $78,684 |
| 2017 | $3,033 | $109,280 | $32,000 | $77,280 |
| 2016 | $2,852 | $102,760 | $32,000 | $70,760 |
| 2015 | $2,713 | $97,560 | $32,000 | $65,560 |
| 2014 | $847 | $32,000 | $32,000 | $0 |
Map
- 4150 Cedar Bridge Walk
- 4165 Hammond Bridge Dr
- 5105 Deerlake Dr
- 3910 Dalwood Dr
- 4130 Millbrook Ct
- 3845 Bridle Creek Dr
- 3820 Ridge Point Dr
- 3415 Fox Hollow Way
- 7260 Fawn Lake Dr
- 7520 Ledgewood Way
- 11800 Carriage Park Ln
- 5235 Villa Lake Ct
- 7067 Walham Grove
- 7335 Lytham Trace
- 6879 Downs Ave
- 595 Barsham Way
- 8480 St Marlo Fairway Dr
- 7045 Harlech Trace
- 3150 Thistle Trail
- 3730 Lakeheath Dr
- 4325 Cedar Bridge Walk Unit 61
- 4315 Cedar Bridge Walk
- 4335 Cedar Bridge Walk
- 4305 Cedar Bridge Walk Unit 63
- 4305 Cedar Bridge Walk
- 4345 Cedar Bridge Walk
- 4355 Cedar Bridge Walk
- 4245 Cedar Bridge Walk Unit 64
- 4245 Cedar Bridge Walk
- 3905 Madison Bridge Dr
- 3915 Madison Bridge Dr
- 3925 Madison Bridge Dr Unit 55
- 3925 Madison Bridge Dr
- 4235 Cedar Bridge Walk Unit 65
- 3935 Madison Bridge Dr
- 4330 Cedar Bridge Walk
- 4320 Cedar Bridge Walk
- 4340 Cedar Bridge Walk
- 4310 Cedar Bridge Walk Unit 33
- 4310 Cedar Bridge Walk