Estimated Value: $333,000 - $402,000
3
Beds
3
Baths
1,839
Sq Ft
$200/Sq Ft
Est. Value
About This Home
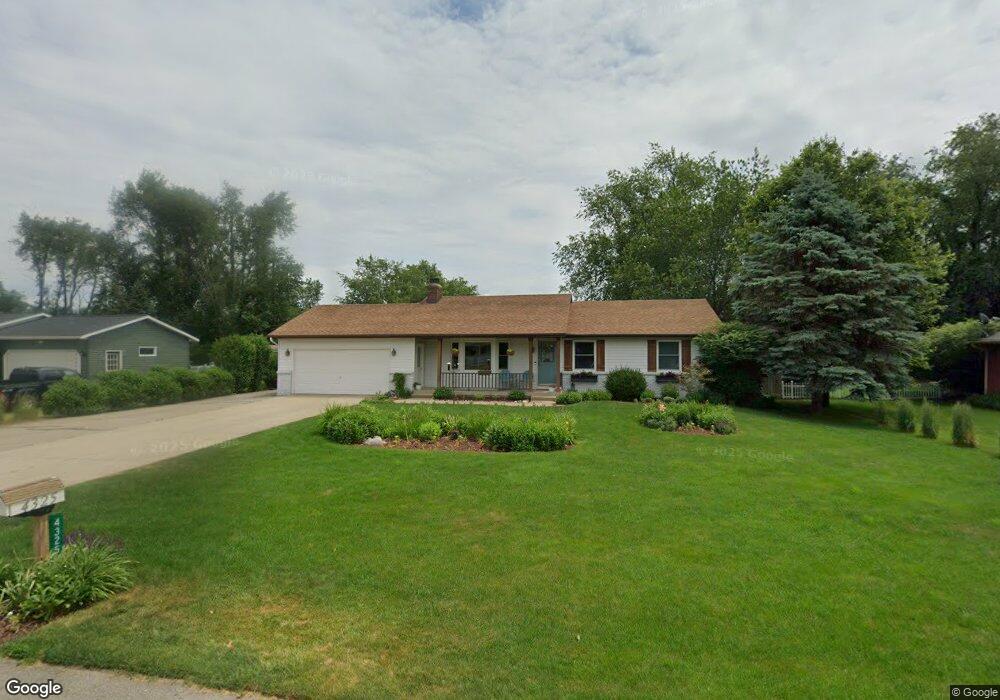
This home is located at 4325 Deerfield Run, Dorr, MI 49323 and is currently estimated at $368,037, approximately $200 per square foot. 4325 Deerfield Run is a home located in Allegan County with nearby schools including Wayland High School, Byron Center Charter School, and St. Stanislaus School.
Ownership History
Date
Name
Owned For
Owner Type
Purchase Details
Closed on
Jul 7, 2011
Sold by
Jpmorgan Chase Bank Na
Bought by
Weber Joseph S and Weber Breanne K
Current Estimated Value
Home Financials for this Owner
Home Financials are based on the most recent Mortgage that was taken out on this home.
Original Mortgage
$111,780
Outstanding Balance
$76,938
Interest Rate
4.52%
Mortgage Type
New Conventional
Estimated Equity
$291,099
Purchase Details
Closed on
Feb 18, 2011
Sold by
Carr Nelson A and Carr Bonnie B
Bought by
Jpmorgan Chase Bank Na
Purchase Details
Closed on
Jan 20, 2011
Sold by
Carr Nelson A and Carr Bonnie B
Bought by
Jpmorgan Chase Bank Na
Purchase Details
Closed on
May 10, 1996
Sold by
Dickman Robert W and Dickman Sandra L
Bought by
Carr Nelson A and Carr Bonnie B
Create a Home Valuation Report for This Property
The Home Valuation Report is an in-depth analysis detailing your home's value as well as a comparison with similar homes in the area
Home Values in the Area
Average Home Value in this Area
Purchase History
| Date | Buyer | Sale Price | Title Company |
|---|---|---|---|
| Weber Joseph S | $108,000 | Sun Title | |
| Jpmorgan Chase Bank Na | -- | None Available | |
| Jpmorgan Chase Bank Na | $89,763 | None Available | |
| Carr Nelson A | $121,900 | -- |
Source: Public Records
Mortgage History
| Date | Status | Borrower | Loan Amount |
|---|---|---|---|
| Open | Weber Joseph S | $111,780 |
Source: Public Records
Tax History
| Year | Tax Paid | Tax Assessment Tax Assessment Total Assessment is a certain percentage of the fair market value that is determined by local assessors to be the total taxable value of land and additions on the property. | Land | Improvement |
|---|---|---|---|---|
| 2025 | $2,753 | $139,600 | $33,500 | $106,100 |
| 2024 | $2,507 | $131,800 | $29,100 | $102,700 |
| 2023 | $2,568 | $113,700 | $24,900 | $88,800 |
| 2022 | $2,507 | $97,000 | $20,800 | $76,200 |
| 2021 | $2,355 | $90,100 | $20,800 | $69,300 |
| 2020 | $2,242 | $88,600 | $20,000 | $68,600 |
| 2019 | $2,242 | $84,700 | $15,500 | $69,200 |
| 2018 | $2,192 | $81,800 | $15,500 | $66,300 |
| 2017 | $0 | $82,700 | $15,500 | $67,200 |
| 2016 | $0 | $70,400 | $15,500 | $54,900 |
| 2015 | -- | $70,400 | $15,500 | $54,900 |
| 2014 | -- | $62,100 | $14,800 | $47,300 |
| 2013 | -- | $59,900 | $14,800 | $45,100 |
Source: Public Records
Map
Nearby Homes
- 1341 142nd Ave
- Lots A&B 142nd Ave
- 4087 Gene Ct
- 4035 Patti Rd
- 4069 21st St
- 4335 Tavistock Dr
- 4316 Sussex Place
- 1125 Russell St
- 10780 Windward Ave SW
- 10785 Windward Ave SW
- 10725 Windward Ave SW
- 4273 Highpoint Dr Unit 112
- 4269 Highpoint Dr Unit 114
- 4271 Highpoint Dr Unit 113
- 4294 Highpoint Dr Unit 103
- 1069 Sunnyside Dr
- 4185 24th St
- 10711 Windward Ave SW
- 136 100th St SW
- 737 100th St SW
- 4327 Deerfield Run
- 4323 Deerfield Run
- 4326 Deerfield Run
- 4321 Deerfield Run
- 4329 Deerfield Run
- 4336 Alpine Dr
- 4322 Deerfield Run
- 4328 Deerfield Run
- 4336 Alpine St
- 4332 Alpine St
- 1757 Briarlane St
- 4319 Deerfield Run
- 4340 Alpine St
- 4328 Alpine St
- 4331 Deerfield Run
- 4324 Alpine St
- 1758 Briarlane St
- 1758 Deerfield Ct
- 4344 Alpine St
- 4320 Deerfield Run
Your Personal Tour Guide
Ask me questions while you tour the home.