Estimated Value: $47,000 - $88,956
2
Beds
1
Bath
950
Sq Ft
$79/Sq Ft
Est. Value
About This Home
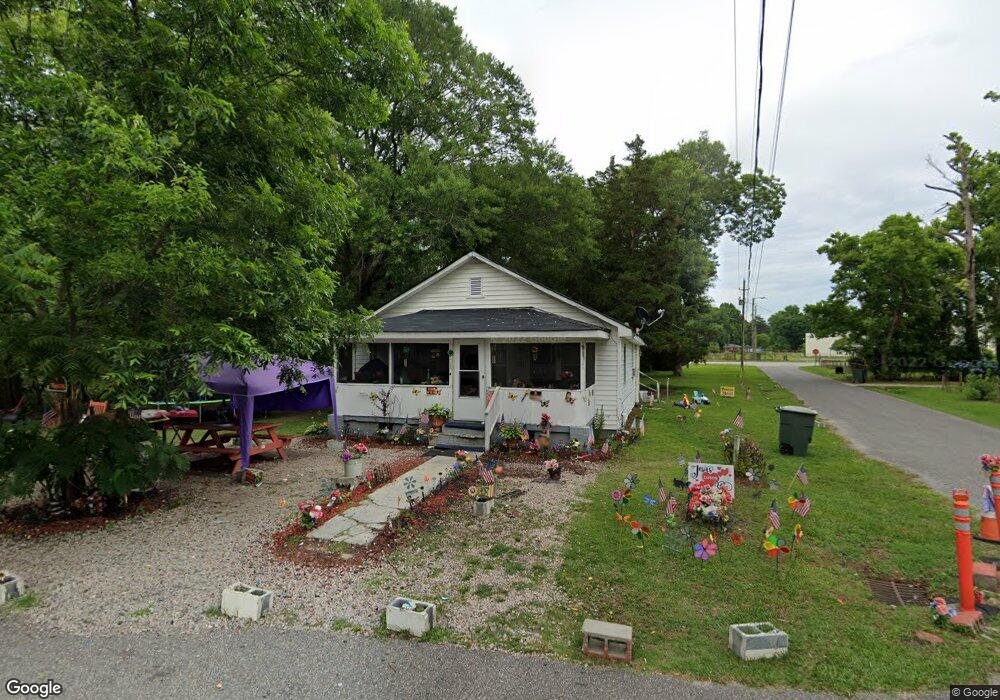
This home is located at 4325 S Pitt St, Ayden, NC 28513 and is currently estimated at $75,489, approximately $79 per square foot. 4325 S Pitt St is a home located in Pitt County with nearby schools including Ayden Elementary School, Ayden Middle School, and Ayden-Grifton High School.
Ownership History
Date
Name
Owned For
Owner Type
Purchase Details
Closed on
Mar 23, 2023
Sold by
Greger William B and Greger Juan
Bought by
Harrell Stephen Ray and Harrell Joy Christian
Current Estimated Value
Purchase Details
Closed on
Jan 20, 2021
Sold by
Canady Real Estate Llc
Bought by
Canady Pitt St Xxiix
Purchase Details
Closed on
Jun 20, 2018
Sold by
Canady Nia and Canady Larry
Bought by
Canady Real Estate Llc
Purchase Details
Closed on
Feb 28, 2017
Sold by
Jenkins John Walter and Jenkins Pamela H
Bought by
Canady Nia and Canady Larry
Home Financials for this Owner
Home Financials are based on the most recent Mortgage that was taken out on this home.
Original Mortgage
$15,002
Interest Rate
4.19%
Mortgage Type
New Conventional
Purchase Details
Closed on
Sep 29, 2009
Sold by
Moonlight Properties Llc
Bought by
Jenkins John Walter and Jenkins Pamela H
Create a Home Valuation Report for This Property
The Home Valuation Report is an in-depth analysis detailing your home's value as well as a comparison with similar homes in the area
Home Values in the Area
Average Home Value in this Area
Purchase History
| Date | Buyer | Sale Price | Title Company |
|---|---|---|---|
| Harrell Stephen Ray | $500,000 | -- | |
| Harrell Stephen Ray | $500,000 | None Listed On Document | |
| Canady Pitt St Xxiix | $3,000 | None Available | |
| Canady Real Estate Llc | -- | -- | |
| Canady Nia | $18,000 | None Available | |
| Jenkins John Walter | $10,000 | None Available |
Source: Public Records
Mortgage History
| Date | Status | Borrower | Loan Amount |
|---|---|---|---|
| Previous Owner | Canady Nia | $15,002 |
Source: Public Records
Tax History Compared to Growth
Tax History
| Year | Tax Paid | Tax Assessment Tax Assessment Total Assessment is a certain percentage of the fair market value that is determined by local assessors to be the total taxable value of land and additions on the property. | Land | Improvement |
|---|---|---|---|---|
| 2025 | $579 | $37,352 | $7,500 | $29,852 |
| 2024 | $567 | $37,352 | $7,500 | $29,852 |
| 2023 | $274 | $12,001 | $2,100 | $9,901 |
| 2022 | $274 | $12,001 | $2,100 | $9,901 |
| 2021 | $274 | $12,001 | $2,100 | $9,901 |
| 2020 | $274 | $12,001 | $2,100 | $9,901 |
| 2019 | $189 | $8,701 | $2,100 | $6,601 |
| 2018 | $183 | $8,701 | $2,100 | $6,601 |
| 2017 | $183 | $8,701 | $2,100 | $6,601 |
| 2016 | -- | $8,701 | $2,100 | $6,601 |
| 2015 | -- | $10,591 | $2,100 | $8,491 |
| 2014 | -- | $10,591 | $2,100 | $8,491 |
Source: Public Records
Map
Nearby Homes
- 4325 Martin Luther King Junior St
- 4318 Martin Luther King jr St
- 4270 High St
- 4264 High St
- 4214 Park Ave
- 0 Blount St
- 4311 Lee St
- 361 Snow Hill St
- 4257 Washington St
- 0 Parcels 20490 20494 10921 Unit 100523857
- 2307 N Carolina 102
- 2293 N Carolina 102
- 1083 Queensland Ln
- 1091 Queensland Ln
- 1082 Queensland Ln
- 1077 Queensland Ln
- 404 Second St
- 4241 Montague Ave
- 4220 Montague Ave
- 522 W 1st St