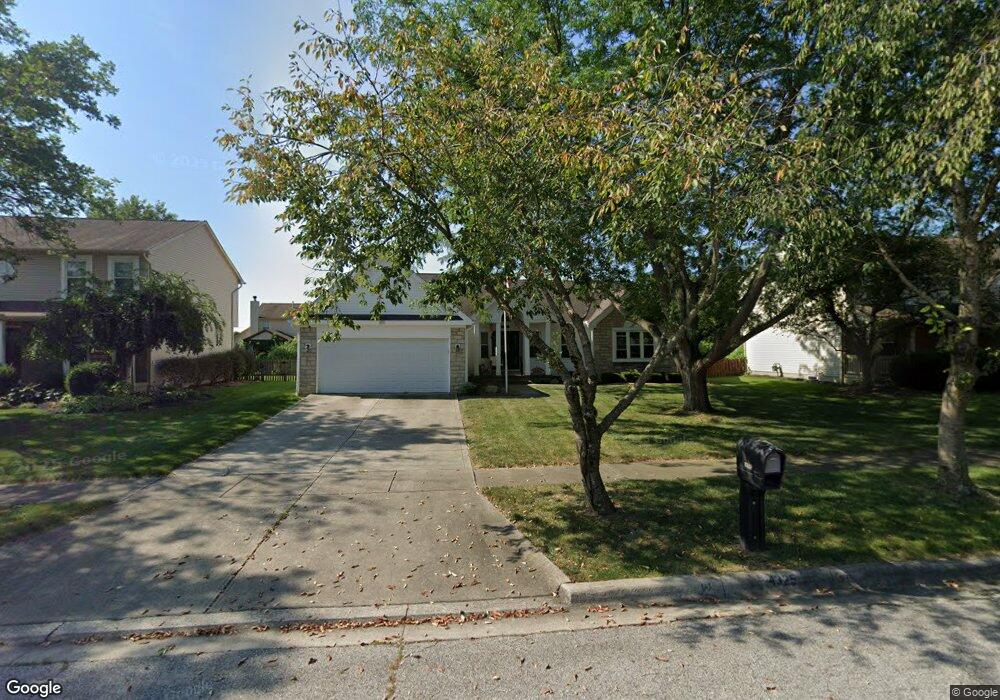
4325 Tahoe Trail Grove City, OH 43123
Estimated Value: $373,521 - $422,000
4
Beds
2
Baths
2,191
Sq Ft
$180/Sq Ft
Est. Value
About This Home
This home is located at 4325 Tahoe Trail, Grove City, OH 43123 and is currently estimated at $393,380, approximately $179 per square foot. 4325 Tahoe Trail is a home located in Franklin County with nearby schools including Holt Crossing Intermediate School, Richard Avenue Elementary School, and Central Crossing High School.
Ownership History
Date
Name
Owned For
Owner Type
Purchase Details
Closed on
May 31, 2002
Sold by
Piper William M and Piper Debra S
Bought by
Edwards David Mark and Edwards Teresa L
Current Estimated Value
Home Financials for this Owner
Home Financials are based on the most recent Mortgage that was taken out on this home.
Original Mortgage
$125,000
Interest Rate
7%
Purchase Details
Closed on
Dec 5, 2000
Sold by
Ratcliffe Timothy and Ratcliffe Jodi
Bought by
Piper William M and Piper Debra S
Home Financials for this Owner
Home Financials are based on the most recent Mortgage that was taken out on this home.
Original Mortgage
$152,000
Interest Rate
7.8%
Purchase Details
Closed on
Dec 15, 1998
Sold by
Rockford Homes Inc
Bought by
Ratcliffe Timothy and Ratcliffe Jod
Home Financials for this Owner
Home Financials are based on the most recent Mortgage that was taken out on this home.
Original Mortgage
$161,400
Interest Rate
6.96%
Create a Home Valuation Report for This Property
The Home Valuation Report is an in-depth analysis detailing your home's value as well as a comparison with similar homes in the area
Home Values in the Area
Average Home Value in this Area
Purchase History
| Date | Buyer | Sale Price | Title Company |
|---|---|---|---|
| Edwards David Mark | $179,000 | -- | |
| Piper William M | $160,000 | -- | |
| Ratcliffe Timothy | $170,300 | -- |
Source: Public Records
Mortgage History
| Date | Status | Borrower | Loan Amount |
|---|---|---|---|
| Closed | Edwards David Mark | $125,000 | |
| Closed | Piper William M | $152,000 | |
| Closed | Ratcliffe Timothy | $161,400 |
Source: Public Records
Tax History Compared to Growth
Tax History
| Year | Tax Paid | Tax Assessment Tax Assessment Total Assessment is a certain percentage of the fair market value that is determined by local assessors to be the total taxable value of land and additions on the property. | Land | Improvement |
|---|---|---|---|---|
| 2024 | $4,804 | $115,430 | $28,000 | $87,430 |
| 2023 | $4,764 | $115,430 | $28,000 | $87,430 |
| 2022 | $4,171 | $77,140 | $14,280 | $62,860 |
| 2021 | $4,251 | $77,140 | $14,280 | $62,860 |
| 2020 | $4,237 | $77,140 | $14,280 | $62,860 |
| 2019 | $3,663 | $63,600 | $11,900 | $51,700 |
| 2018 | $3,632 | $63,600 | $11,900 | $51,700 |
| 2017 | $3,624 | $63,600 | $11,900 | $51,700 |
| 2016 | $3,612 | $58,590 | $10,290 | $48,300 |
| 2015 | $3,613 | $58,590 | $10,290 | $48,300 |
| 2014 | $3,616 | $58,590 | $10,290 | $48,300 |
| 2013 | $1,812 | $61,670 | $10,815 | $50,855 |
Source: Public Records
Map
Nearby Homes
- 4355 Lake George Place
- 3805 Carlotta St
- 4209 Marsol Ave
- 3892 Ponds Edge St
- 3673 Magnolia St
- 4041 Cypress Ave
- 4368 Promenade Ave
- 4363 Promenade Ave
- 4322 Archway Ct
- 4008 Thompson Ave
- 4386 Big Run Rd S
- 3990 Thompson Ave
- 3145 Demorest Rd
- 3663 Glacial Ln
- Fifth Avenue Plan at The Grove at Beulah Park
- Abbeyville Plan at The Grove at Beulah Park
- Boardwalk Plan at The Grove at Beulah Park
- Woodward Plan at The Grove at Beulah Park
- Park Place Plan at The Grove at Beulah Park
- 3786 Brody Dr Unit Lot 188
- 4317 Tahoe Trail
- 4333 Tahoe Trail
- 4322 Lemon Lake Ct
- 4314 Lemon Lake Ct
- 4309 Tahoe Trail
- 4330 Lemon Lake Ct
- 4320 Tahoe Trail
- 4306 Lemon Lake Ct
- 4328 Tahoe Trail
- 4312 Tahoe Trail
- 4301 Tahoe Trail
- 4304 Tahoe Trail
- 4298 Lemon Lake Ct
- 3691 Lake Mead Dr
- 3683 Lake Mead Dr
- 4355 Lake George Dr
- 4296 Tahoe Trail
- 4327 Lemon Lake Ct
- 4293 Tahoe Trail
- 3675 Lake Mead Dr