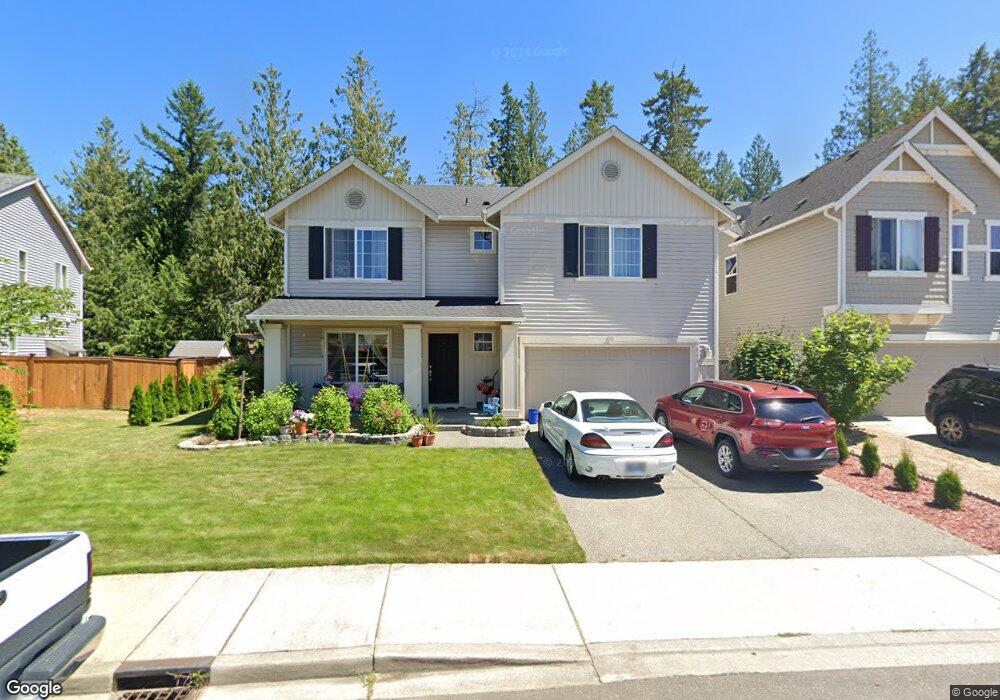
4326 Chanting Cir SW Port Orchard, WA 98367
McCormick Woods NeighborhoodEstimated Value: $526,101 - $598,000
3
Beds
3
Baths
2,078
Sq Ft
$266/Sq Ft
Est. Value
About This Home
This home is located at 4326 Chanting Cir SW, Port Orchard, WA 98367 and is currently estimated at $553,525, approximately $266 per square foot. 4326 Chanting Cir SW is a home located in Kitsap County with nearby schools including Sunnyslope Elementary School, Cedar Heights Middle School, and South Kitsap High School.
Ownership History
Date
Name
Owned For
Owner Type
Purchase Details
Closed on
Sep 2, 2021
Sold by
Santos Elmer P and Santos Larvic C
Bought by
Constantino Vicente M and Constantino Vicenta J
Current Estimated Value
Home Financials for this Owner
Home Financials are based on the most recent Mortgage that was taken out on this home.
Original Mortgage
$248,000
Outstanding Balance
$225,662
Interest Rate
2.8%
Mortgage Type
New Conventional
Estimated Equity
$327,863
Purchase Details
Closed on
Dec 21, 2011
Sold by
The Quadrant Corporation
Bought by
Constantino Vicenta J and Constantino Vicente M
Home Financials for this Owner
Home Financials are based on the most recent Mortgage that was taken out on this home.
Original Mortgage
$238,789
Interest Rate
3.93%
Mortgage Type
FHA
Create a Home Valuation Report for This Property
The Home Valuation Report is an in-depth analysis detailing your home's value as well as a comparison with similar homes in the area
Home Values in the Area
Average Home Value in this Area
Purchase History
| Date | Buyer | Sale Price | Title Company |
|---|---|---|---|
| Constantino Vicente M | -- | Accommodation | |
| Constantino Vicenta J | $245,280 | First American Title Ins |
Source: Public Records
Mortgage History
| Date | Status | Borrower | Loan Amount |
|---|---|---|---|
| Open | Constantino Vicente M | $248,000 | |
| Previous Owner | Constantino Vicenta J | $238,789 |
Source: Public Records
Tax History Compared to Growth
Tax History
| Year | Tax Paid | Tax Assessment Tax Assessment Total Assessment is a certain percentage of the fair market value that is determined by local assessors to be the total taxable value of land and additions on the property. | Land | Improvement |
|---|---|---|---|---|
| 2026 | $3,893 | $421,610 | $97,980 | $323,630 |
| 2025 | $3,893 | $446,120 | $101,550 | $344,570 |
| 2024 | $3,758 | $446,120 | $101,550 | $344,570 |
| 2023 | $3,755 | $446,120 | $101,550 | $344,570 |
| 2022 | $3,748 | $374,870 | $92,100 | $282,770 |
| 2021 | $3,662 | $347,190 | $85,020 | $262,170 |
| 2020 | $3,504 | $322,160 | $78,720 | $243,440 |
| 2019 | $2,852 | $287,080 | $68,180 | $218,900 |
| 2018 | $3,179 | $256,740 | $60,800 | $195,940 |
| 2017 | $2,813 | $256,740 | $60,800 | $195,940 |
| 2016 | $2,847 | $240,510 | $56,820 | $183,690 |
| 2015 | $2,747 | $235,920 | $56,820 | $179,100 |
| 2014 | -- | $231,320 | $56,820 | $174,500 |
| 2013 | -- | $209,850 | $53,680 | $156,170 |
Source: Public Records
Map
Nearby Homes
- 3850 Portside Dr
- 2430 Puget Sound Blvd
- 4710 Rutherford Cir SW
- 3978 McCormick Village Dr
- 3974 McCormick Village Dr
- 3970 McCormick Village Dr
- 3966 McCormick Village Dr
- 3952 McCormick Village Dr
- 3944 McCormick Village Dr
- 3948 McCormick Village Dr
- 3977 McCormick Village Dr
- 3935 McCormick Village Dr
- 3973 McCormick Village Dr
- 3985 McCormick Village Dr
- 3939 McCormick Village Dr
- 3969 McCormick Village Dr
- 3969 McCormick Village Dr
- 3955 McCormick Village Dr
- 3985 McCormick Village Dr
- 3959 McCormick Village Dr
- 4320 Chanting Cir SW
- 4332 Chanting Cir SW
- 4338 Chanting Cir SW
- 4314 Chanting Cir SW
- 4321 Chanting Cir SW
- 4327 Chanting Cir SW
- 2701 SW Chowchilla Way
- 4344 Chanting Cir SW
- 4308 Chanting Cir SW
- 2707 SW Chowchilla Way
- 2713 SW Chowchilla Way
- 4381 Chanting Cir SW
- 4302 Chanting Cir SW
- 4350 Chanting Cir SW
- 2719 SW Chowchilla Way
- 2700 SW Chowchilla Way
- 3165 SW Chowchilla Way
- 2725 SW Chowchilla Way
- 4296 Chanting Cir SW