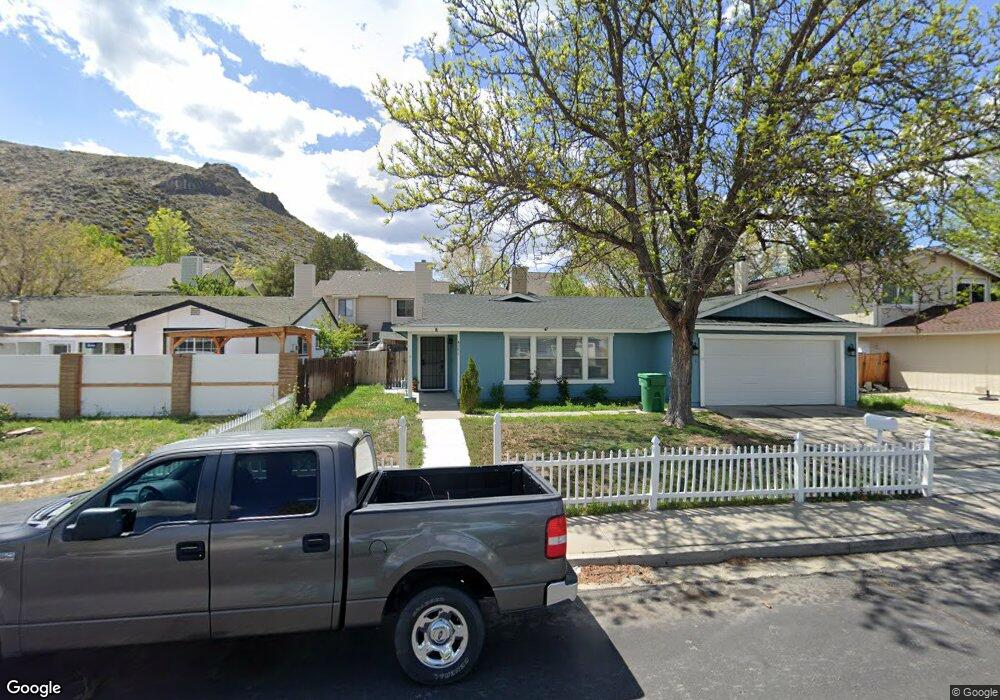
4326 Loreto Ln Reno, NV 89502
Hidden Valley NeighborhoodEstimated Value: $405,588 - $437,000
3
Beds
3
Baths
1,313
Sq Ft
$322/Sq Ft
Est. Value
About This Home
This home is located at 4326 Loreto Ln, Reno, NV 89502 and is currently estimated at $422,897, approximately $322 per square foot. 4326 Loreto Ln is a home located in Washoe County with nearby schools including Donner Springs Elementary School, Edward L Pine Middle School, and Damonte Ranch High School.
Ownership History
Date
Name
Owned For
Owner Type
Purchase Details
Closed on
Jul 2, 2004
Sold by
Smith David R
Bought by
Pawlowski Stephen
Current Estimated Value
Purchase Details
Closed on
Jun 19, 1998
Sold by
Smith David R
Bought by
Smith David R and The David Smith 1998 Trust
Purchase Details
Closed on
Dec 23, 1996
Sold by
Glenn Jolie
Bought by
Smith David R
Home Financials for this Owner
Home Financials are based on the most recent Mortgage that was taken out on this home.
Original Mortgage
$106,200
Interest Rate
5.12%
Purchase Details
Closed on
Nov 9, 1993
Sold by
Howell Debra A and Pair Debra Ann
Bought by
Glenn Jolie
Purchase Details
Closed on
Nov 8, 1993
Sold by
Glenn Joe R
Bought by
Glenn Jolie
Create a Home Valuation Report for This Property
The Home Valuation Report is an in-depth analysis detailing your home's value as well as a comparison with similar homes in the area
Home Values in the Area
Average Home Value in this Area
Purchase History
| Date | Buyer | Sale Price | Title Company |
|---|---|---|---|
| Pawlowski Stephen | $230,000 | Stewart Title Of Northern Nv | |
| Smith David R | -- | -- | |
| Smith David R | $118,000 | Stewart Title | |
| Glenn Jolie | $25,000 | Western Title Company Inc | |
| Glenn Jolie | -- | Western Title Company Inc |
Source: Public Records
Mortgage History
| Date | Status | Borrower | Loan Amount |
|---|---|---|---|
| Previous Owner | Smith David R | $106,200 |
Source: Public Records
Tax History
| Year | Tax Paid | Tax Assessment Tax Assessment Total Assessment is a certain percentage of the fair market value that is determined by local assessors to be the total taxable value of land and additions on the property. | Land | Improvement |
|---|---|---|---|---|
| 2026 | $1,229 | $63,952 | $31,115 | $32,837 |
| 2024 | $1,596 | $62,035 | $27,125 | $34,910 |
| 2023 | $1,550 | $59,766 | $28,525 | $31,241 |
| 2022 | $1,505 | $50,996 | $23,765 | $27,231 |
| 2021 | $1,461 | $46,386 | $18,865 | $27,521 |
| 2020 | $1,417 | $46,647 | $18,620 | $28,027 |
| 2019 | $1,376 | $44,232 | $16,765 | $27,467 |
| 2018 | $1,305 | $38,458 | $11,410 | $27,048 |
| 2017 | $1,278 | $36,895 | $10,640 | $26,255 |
| 2016 | $1,245 | $36,380 | $8,820 | $27,560 |
| 2015 | $313 | $36,471 | $8,750 | $27,721 |
| 2014 | $1,207 | $32,993 | $6,230 | $26,763 |
| 2013 | -- | $31,922 | $5,390 | $26,532 |
Source: Public Records
Map
Nearby Homes
- 4405 Mesa Grande Ct
- 4245 Ranchita Way
- 4418 Matich Dr
- 4546 Matich Dr Unit 103
- 4528 Matich Dr Unit 109
- 4400 Alexander Lake Rd
- 4634 Rio Poco Rd Unit 68
- 4465 Boca Way Unit 66
- 4465 Boca Way Unit 22
- 4465 Boca Way Unit 220
- 4465 Boca Way Unit 173
- 4465 Boca Way Unit 175
- 4465 Boca Way Unit 229
- 4465 Boca Way Unit 39
- 4465 Boca Way Unit 89
- 4917 Hombre Way
- 320 Lucky Ln
- 4060 Bristlecone Ct Unit 1
- 317 Lucky Ln
- 4125 Mira Loma Dr
- 4328 Loreto Ln
- 4324 Loreto Ln Unit 1
- 4322 Loreto Ln
- 4330 Loreto Ln
- 4320 Loreto Ln
- 4332 Loreto Ln
- 4351 Rio Poco Rd
- 4341 Rio Poco Rd
- 4361 Rio Poco Rd
- 4325 Loreto Ln
- 4318 Loreto Ln
- 4338 Loreto Ln
- 4327 Loreto Ln
- 4323 Loreto Ln
- 4331 Loreto Ln Unit 1
- 4321 Loreto Ln
- 4331 Rio Poco Rd
- 4316 Loreto Ln
- 4342 Loreto Ln
- 4371 Rio Poco Rd
Your Personal Tour Guide
Ask me questions while you tour the home.