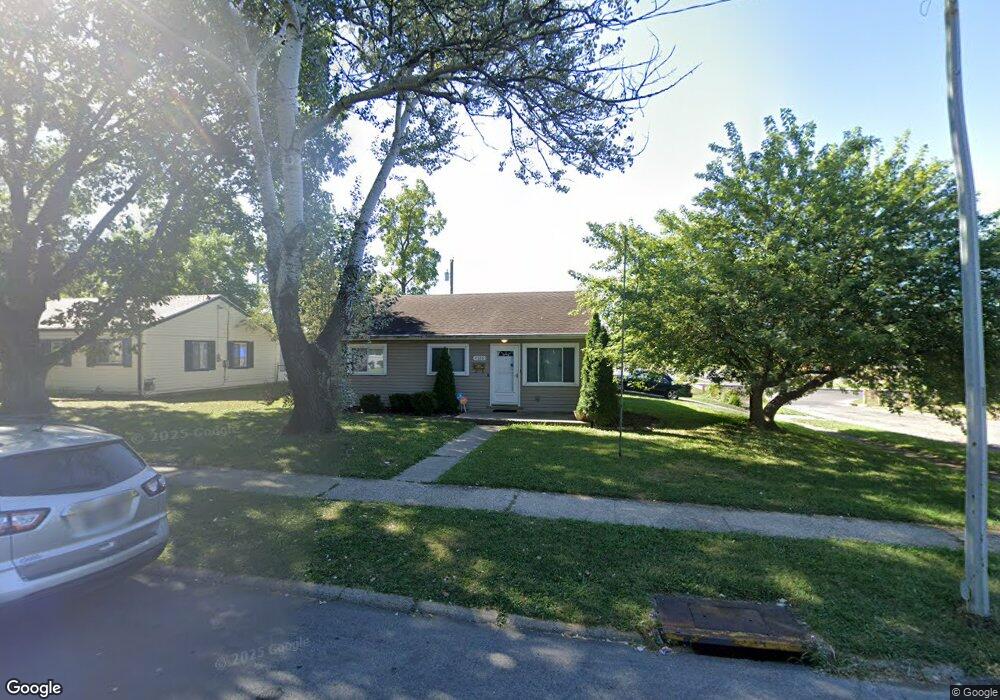
4326 Redonda Ln Dayton, OH 45416
Estimated Value: $56,000 - $91,000
3
Beds
1
Bath
864
Sq Ft
$93/Sq Ft
Est. Value
About This Home
This home is located at 4326 Redonda Ln, Dayton, OH 45416 and is currently estimated at $80,062, approximately $92 per square foot. 4326 Redonda Ln is a home located in Montgomery County with nearby schools including Valerie Elementary School, Imagine Klepinger Road Community School, and North Dayton School of Science & Discovery.
Ownership History
Date
Name
Owned For
Owner Type
Purchase Details
Closed on
Jun 13, 2005
Sold by
Wachovia Bank Of Delaware Na
Bought by
Homestart Inc
Current Estimated Value
Purchase Details
Closed on
Jan 28, 2005
Sold by
Butler April
Bought by
Wachovia Bank Of Delaware Na
Purchase Details
Closed on
Jul 20, 1999
Sold by
Chase Manhattan Mtg Corp
Bought by
Medley Paul and Medley Courtney
Home Financials for this Owner
Home Financials are based on the most recent Mortgage that was taken out on this home.
Original Mortgage
$37,046
Interest Rate
7.54%
Purchase Details
Closed on
Sep 8, 1998
Sold by
Scott Richard W
Bought by
Chase Manhattan Mtg Corp
Purchase Details
Closed on
Aug 11, 1998
Sold by
Scott Richard W
Bought by
First Union Bank Of North Carolina
Create a Home Valuation Report for This Property
The Home Valuation Report is an in-depth analysis detailing your home's value as well as a comparison with similar homes in the area
Home Values in the Area
Average Home Value in this Area
Purchase History
| Date | Buyer | Sale Price | Title Company |
|---|---|---|---|
| Homestart Inc | $31,500 | -- | |
| Wachovia Bank Of Delaware Na | $30,000 | None Available | |
| Medley Paul | $39,000 | -- | |
| Chase Manhattan Mtg Corp | $35,000 | -- | |
| First Union Bank Of North Carolina | $35,000 | -- | |
| Chase Manhattan Mtg Corp | $35,000 | -- |
Source: Public Records
Mortgage History
| Date | Status | Borrower | Loan Amount |
|---|---|---|---|
| Previous Owner | Medley Paul | $37,046 |
Source: Public Records
Tax History Compared to Growth
Tax History
| Year | Tax Paid | Tax Assessment Tax Assessment Total Assessment is a certain percentage of the fair market value that is determined by local assessors to be the total taxable value of land and additions on the property. | Land | Improvement |
|---|---|---|---|---|
| 2024 | $887 | $14,020 | $3,200 | $10,820 |
| 2023 | $887 | $14,020 | $3,200 | $10,820 |
| 2022 | $1,008 | $11,850 | $2,710 | $9,140 |
| 2021 | $1,003 | $11,850 | $2,710 | $9,140 |
| 2020 | $1,000 | $11,850 | $2,710 | $9,140 |
| 2019 | $1,055 | $11,190 | $2,710 | $8,480 |
| 2018 | $1,056 | $11,190 | $2,710 | $8,480 |
| 2017 | $1,049 | $11,190 | $2,710 | $8,480 |
| 2016 | $1,069 | $11,190 | $2,710 | $8,480 |
| 2015 | $1,018 | $11,190 | $2,710 | $8,480 |
| 2014 | $1,018 | $11,190 | $2,710 | $8,480 |
| 2012 | -- | $17,150 | $3,660 | $13,490 |
Source: Public Records
Map
Nearby Homes
- 4235 Merryfield Ave
- 3462 Arlene Ave
- 4237 Nevada Ave
- 4322 Annapolis Ave
- 4131 Merryfield Ave
- 3678 Wilmore St
- LOT#26 Glenbrook Dr
- 2610 Marchmont Dr
- Lot#14 Bridgeport Dr
- Lot#15 Bridgeport Dr
- 3997 Mayview Dr
- 4703 Natchez Ave
- Lot#24 Glenbrook Dr
- Lot#1 Glenbrook Dr
- Lot#21 Glenbrook Dr
- Lot#25 Glenbrook Dr
- 4651 Christopher Ave
- 4831 Free Pike
- 4180 Indian Ln
- 2726 Wentworth Ave
- 4314 Redonda Ln
- 4352 Redonda Ln
- 4302 Redonda Ln
- 4325 Redonda Ln
- 4313 Redonda Ln
- 4364 Redonda Ln
- 4288 Redonda Ln
- 4351 Redonda Ln
- 4301 Redonda Ln
- 4311 Catalina Ave
- 4363 Redonda Ln
- 4378 Redonda Ln
- 3701 Parkfield Place
- 4274 Redonda Ln
- 4352 Catalina Ave
- 4377 Redonda Ln
- 3623 Fair Ln
- 3713 Parkfield Place
- 4321 Catalina Ave
- 4392 Redonda Ln